The Intel Skylake-X Review: Core i9 7900X, i7 7820X and i7 7800X Tested
by Ian Cutress on June 19, 2017 9:01 AM ESTBenchmarking Performance: CPU Web Tests
One of the issues when running web-based tests is the nature of modern browsers to automatically install updates. This means any sustained period of benchmarking will invariably fall foul of the 'it's updated beyond the state of comparison' rule, especially when browsers will update if you give them half a second to think about it. Despite this, we were able to find a series of commands to create an un-updatable version of Chrome 56 for our 2017 test suite. While this means we might not be on the bleeding edge of the latest browser, it makes the scores between CPUs comparable.
SunSpider 1.0.2
The oldest web-based benchmark in this portion of our test is SunSpider. This is a very basic javascript algorithm tool, and ends up being more a measure of IPC and latency than anything else, with most high-performance CPUs scoring around about the same. The basic test is looped 10 times and the average taken. We run the basic test 4 times.
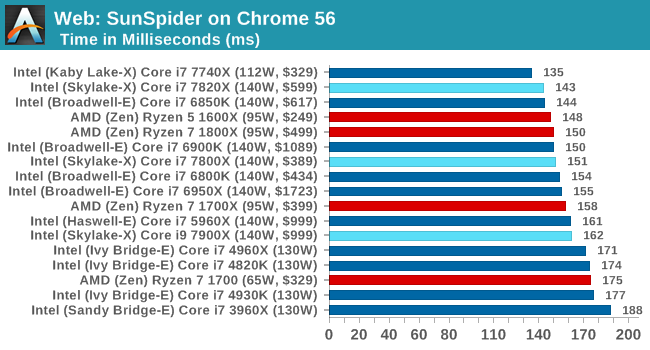
Sunspider goes after peak frequency most of the time, althoguh there is some variation as it moves into basically becoming a legacy test.
Mozilla Kraken 1.1
Kraken is another Javascript based benchmark, using the same test harness as SunSpider, but focusing on more stringent real-world use cases and libraries, such as audio processing and image filters. Again, the basic test is looped ten times, and we run the basic test four times.
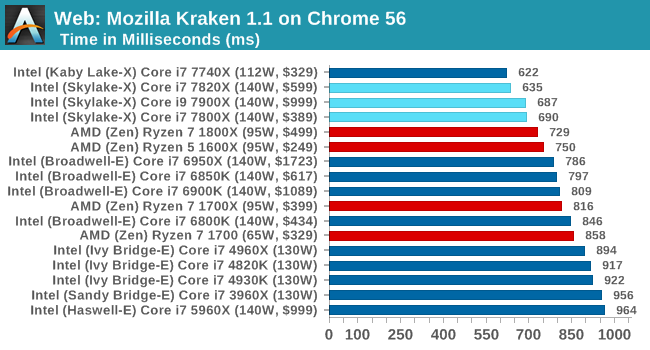
Kraken is more of an intense attack on JS, and still regularly sorts by IPC and frequency.
Google Octane 2.0
Along with Mozilla, as Google is a major browser developer, having peak JS performance is typically a critical asset when comparing against the other OS developers. In the same way that SunSpider is a very early JS benchmark, and Kraken is a bit newer, Octane aims to be more relevant to real workloads, especially in power constrained devices such as smartphones and tablets.
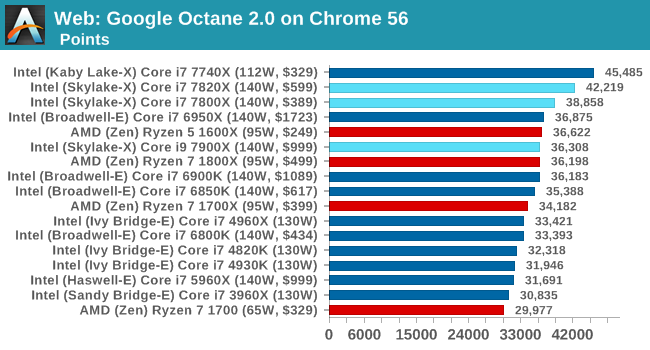
Octane seems to be an optimization target, and with the new Skylake-X it shows.
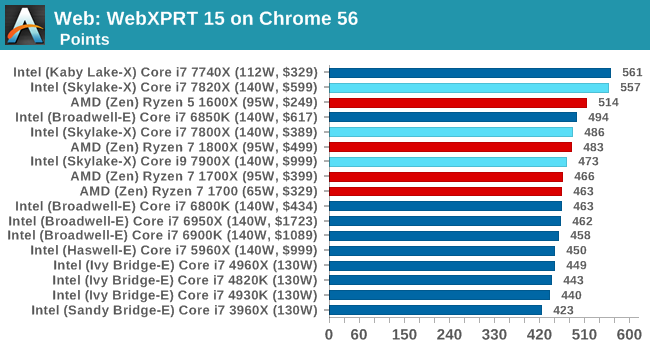
WebXPRT 2015
While the previous three benchmarks do calculations in the background and represent a score, WebXPRT is designed to be a better interpretation of visual workloads that a professional user might have, such as browser based applications, graphing, image editing, sort/analysis, scientific analysis and financial tools.


264 Comments
View All Comments
Slappi2 - Monday, June 19, 2017 - link
Running 1080s, doubt I'll notice.Luckz - Monday, June 19, 2017 - link
That's an impressive review / article considering the source.prophet001 - Monday, June 19, 2017 - link
The TDP on the chip is 140W. If they can't cool it then there's a problem with the heat spreader.How well it overclocks is another point of discussion separate from this one.
prisonerX - Monday, June 19, 2017 - link
And yet the only reason you're seeing it at all is becuase of AMD. You epitomise the pure, untrammeled genius of typical Intel customers.Spunjji - Tuesday, June 20, 2017 - link
This is lost on Slappi.FreckledTrout - Monday, June 19, 2017 - link
Slappi2, you reading the same charts? Also have you seen game reviews on other sites. The 1800x holds its own pretty well compared to t he 7820x 8-core, yes the 7820x is faster but not by a huge margin. We don't have Thredripper just yet to see AMD's 10 core comparison so saying Intel's 10 core is killing AMD's 8-core models is a bit disingenuous.AnandTechReader2017 - Monday, June 19, 2017 - link
The review is missing power consumption, clock speed and current price.At no point is it stated what clock speed anything is running at, it could be that Ryzen is running at base and Intel running overclocked (as speedshift would allow). There are also no comparisons with speedshift on/off.
There is no mention of power draw, the Intel processors are all using a 112/130/140W envelope, but are probably way below that with base, while Ryzen is 95/65W with no mention if overlocked above that envelope or underclocked.
If you check Amazon, one can get the R7 1800X for $439 versus the $499 they posted.
Also, the top Intel chips are competing with Thread Ripper, not Ryzen 7.
You're probably going to accuse me of fanboyism, I just don't like it if so many test details are missing. There is also no mention of temperature at max load, etc.
AnandTechReader2017 - Monday, June 19, 2017 - link
To add: They also have 2666MHz and 3000MHz RAM, yet they don't state what clock speed the test is run at.There is so much information missing.
Ian Cutress - Monday, June 19, 2017 - link
Power consumption is added. Sorry, I'm currently half-way around the world suffering jet lag - I had the graph compiled, I just forgot to write about it. It's been added.Clock Speed: As per the first page.
Current Pricing: As per the first page.
With regards the recent price drops from AMD on the Ryzen chips - everything seems to point that this is distributor driven. We've not seen anything official from AMD (such as price lists) that confirm an official price drop. If you have a link to that, please share.
On the DRAM: our standard policy as with every review is to run JEDEC for the maximum officially supported frequency. Nothing changes in this review. So that's DDR4-2666 for the 7900X and 7820X, and DDR4-2400 for the 7800X.
Tamz_msc - Monday, June 19, 2017 - link
What benchmark was used for the power consumption data?