Sizing Up Servers: Intel's Skylake-SP Xeon versus AMD's EPYC 7000 - The Server CPU Battle of the Decade?
by Johan De Gelas & Ian Cutress on July 11, 2017 12:15 PM EST- Posted in
- CPUs
- AMD
- Intel
- Xeon
- Enterprise
- Skylake
- Zen
- Naples
- Skylake-SP
- EPYC
Floating Point
Normally our HPC benchmarking is centered around OpenFoam, a CFD software we have used for a number of articles over the years. However, since we moved to Ubuntu 16.04, we could not get it to work anymore. So we decided to change our floating point intensive benchmark for now. For our latest article, we're testing with C-ray, POV-Ray, and NAMD.
The idea is to measure:
- A FP benchmark that is running out of the L1 (C-ray)
- A FP benchmark that is running out of the L2 (POV-Ray)
- And one that is using the memory subsytem quite often (NAMD)
Floating Point: C-ray
C-ray is an extremely simple ray-tracer which is not representative of any real world raytracing application. In fact, it is essentially a floating point benchmark that runs out of the L1-cache. Luckily it is not as synthetic and meaningless as Whetstone, as you can actually use the software to do simple raytracing.
We use the standard benchmarking resolution (3840x2160) and the "sphfract" file to measure performance. The binary was precompiled.
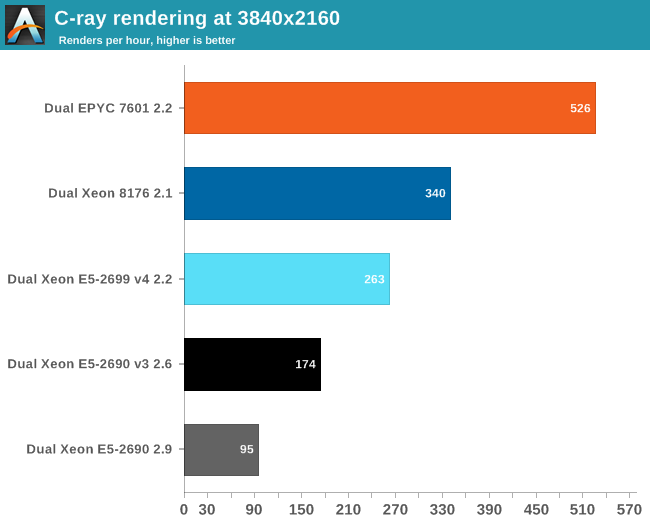
Wow. What just happened? It looks like a landslide victory for the raw power of the four FP pipes of Zen: the EPYC chip is no less than 50% faster than the competition. Of course, it is easy to feed FP units if everything resides in the L1. Next stop, POV-Ray.
Floating Point: POV-Ray 3.7
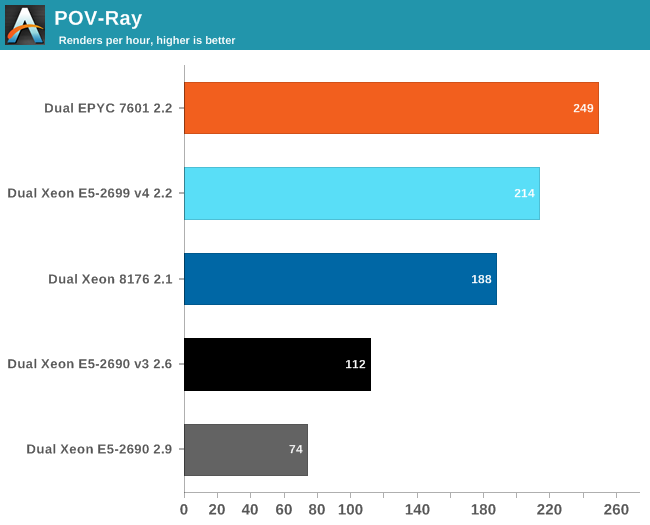
POV-Ray is known to run mostly out of the L2-cache, so the massive DRAM bandwidth of the EPYC CPU does not play a role here. Nevertheless, the EPYC CPU performance is pretty stunning: about 16% faster than Intel's Xeon 8176. But what if AVX and DRAM access come in to play? Let us check out NAMD.
Floating Point: NAMD
Developed by the Theoretical and Computational Biophysics Group at the University of Illinois Urbana-Champaign, NAMD is a set of parallel molecular dynamics codes for extreme parallelization on thousands of cores. NAMD is also part of SPEC CPU2006 FP. In contrast with previous FP benchmarks, the NAMD binary is compiled with Intel ICC and optimized for AVX.
First, we used the "NAMD_2.10_Linux-x86_64-multicore" binary. We used the most popular benchmark load, apoa1 (Apolipoprotein A1). The results are expressed in simulated nanoseconds per wall-clock day. We measure at 500 steps.
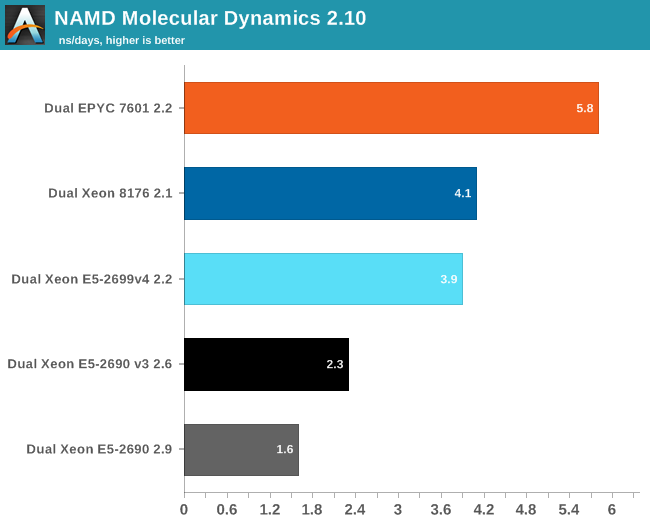
Again, the EPYC 7601 simply crushes the competition with 41% better performance than Intel's 28-core. Heavily vectorized code (like Linpack) might run much faster on Intel, but other FP code seems to run faster on AMD's newest FPU.
For our first shot with this benchmark, we used version 2.10 to be able to compare to our older data set. Version 2.12 seems to make better use of "Intel's compiler vectorization and auto-dispatch has improved performance for Intel processors supporting AVX instructions". So let's try again:
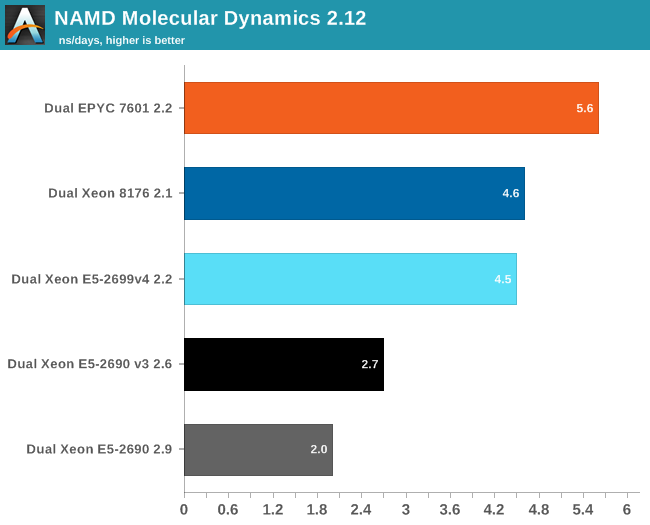
The older Xeons see a perforance boost of about 25%. The improvement on the new Xeons is a lot lower: about 13-15%. Remarkable is that the new binary is slower on the EPYC 7601: about 4%. That simply begs for more investigation: but the deadline was too close. Nevertheless, three different FP tests all point in the same direction: the Zen FP unit might not have the highest "peak FLOPs" in theory, there is lots of FP code out there that runs best on EPYC.


219 Comments
View All Comments
Panxa - Sunday, July 16, 2017 - link
"Competition has spoiled the naming convention Intels 14 === competetions 7 or 10"The node naming convention used to be the gate length, however that has become irrelevant. Intel 14 nm gate lenghth is about 1.5x and 10 nm about 1.8x. Companies and organizations have developed quite accurate models to asses process density with equations based on process poarameters like CPP and MPP to what they call a "standard node"
"Intel used to maintain 2 year lead now grew that to 3-4year lead"
Don't belive intel propaganda. Intel takes the lead in 2014 with their 14nm process with a standard node value of 12.1. Samsung and then TSMC take the lead in 2017 with their 10nm processes having standard node values of 11.2 and 10.3 respectively. Intel will retake the the lead back when they deliver their 10nm process with a standard node value of 8.3. However it will be a short lived lead, TSMC will retake the lead back with their 7nm with a standard node of 7.9 before GLOBALFOUNDRIES takes the lead in 2018 with their 7nm process with a standard node value of 7.8. The gap is gone !!!
"yet their revenue profits grow year over year"
Wrong. Intel revenue for the last years remained fairly constant
2011 grow
2012 decline
2013 decline
2014 grow
2015 decline
2016 grow
All in all from 2011 to 2016 revenue went from 54 billion to 59 billion. If we take into account inflation $54 billion in the year 2011 is worth $58.70 billion today.
Not to mention that Samsung has overtaken Intel to become the world No.1 semiconductor company, and that a "pure play" foundry like TSMC has surpassed intel in market CAP
johnp_ - Wednesday, July 12, 2017 - link
The Xeon Bronze Table on Page 7 seems to have an error. It lists the 4112 as having 5.50MB L3, but ark says it has 8.25MB, just like the 3104, so it looks like it has an above-average L3/Core:https://ark.intel.com/products/123551
Ian Cutress - Friday, July 14, 2017 - link
I've got Intel documents from our briefings that say it has the regular 1.375MB/core allocation, and others saying it has 8.25MB. I'm double checking.johnp_ - Friday, July 21, 2017 - link
All commercial listings and most reviews I've seen online show the processor with 8.25MB as well.Do you have any further information from Intel?
pepoluan - Wednesday, July 12, 2017 - link
What I'm dying to know: Performance when running as virtualization host. Using Xen, VMware, and Hyper-V.Threska - Saturday, July 22, 2017 - link
Virtualization itself, and more importantly virtualization security.Sparkyman215 - Wednesday, July 12, 2017 - link
Typo here: Intel will seven different versions of the chipset, varying in 10G and QAT support, but also varying in TDP:tmbm50 - Wednesday, July 12, 2017 - link
One thing to consider when considering value is the Microsoft Server 2016 core tax.....assuming your mission critical apps are still tied to MS ;-)Server 2016 now chargers per core with an 8 core socket as the base. The Window license for a 32 core server is NUTS.
I'm surprised AMD and Intel are not pushing Microsoft on this. For datacenters like ourselves its pushing us to 8 core sku's with more 2U nodes.
msroadkill612 - Wednesday, July 12, 2017 - link
Aye, its a fuuny world lad.The way the automobile panned out differently in different countries, was laargely die to fuel tax regimes, rather than technology.
i.e. what is the best way to cheat a bit on the incumbent tax rules of germany/france/uk vs a more laissez faire USA. In UK, u were taxed on horsepower, but u could cheat a bit w/ hi revs & more gears - that sort of thing.
rahvin - Wednesday, July 12, 2017 - link
Who runs any Windows service on bare metal these days? If you haven't virtulalized your windows servers running on KVM you should.