Launching the #CPUOverload Project: Testing Every x86 Desktop Processor since 2010
by Dr. Ian Cutress on July 20, 2020 1:30 PM ESTCPU Tests: Synthetic
Most of the people in our industry have a love/hate relationship when it comes to synthetic tests. On the one hand, they’re often good for quick summaries of performance and are easy to use, but most of the time the tests aren’t related to any real software. Synthetic tests are often very good at burrowing down to a specific set of instructions and maximizing the performance out of those. Due to requests from a number of our readers, we have the following synthetic tests.
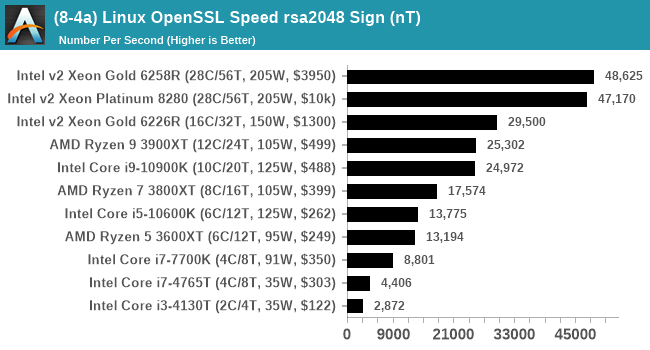
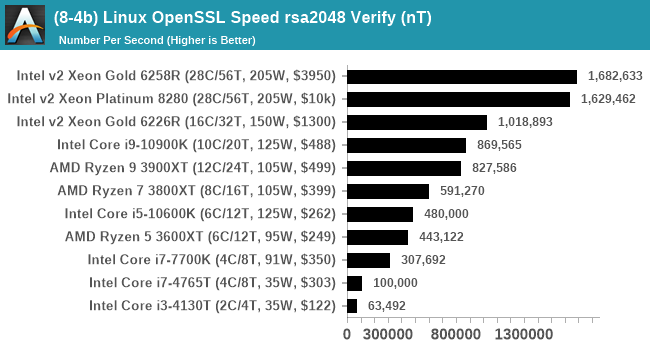
Linux OpenSSL Speed
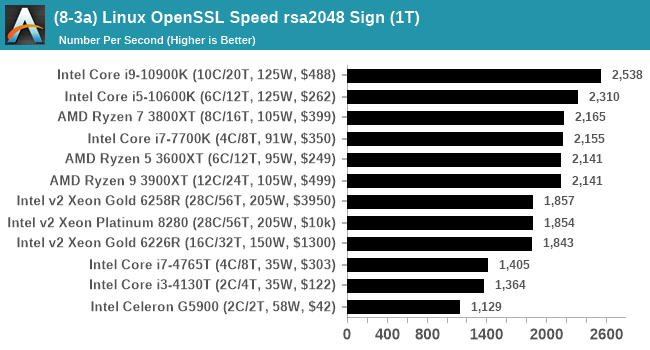
In our last review, and on my twitter, I opined about potential new benchmarks for our suite. One of our readers reached out to me and stated that he was interested in looking at OpenSSL hashing rates in Linux. Luckily OpenSSL in Linux has a function called ‘speed’ that allows the user to determine how fast the system is for any given hashing algorithm, as well as signing and verifying messages.
OpenSSL offers a lot of algorithms to choose from, and based on a quick Twitter poll, we narrowed it down to the following:
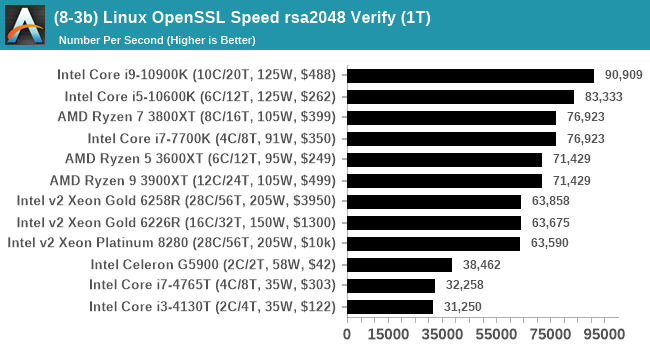
- rsa2048 sign and rsa2048 verify
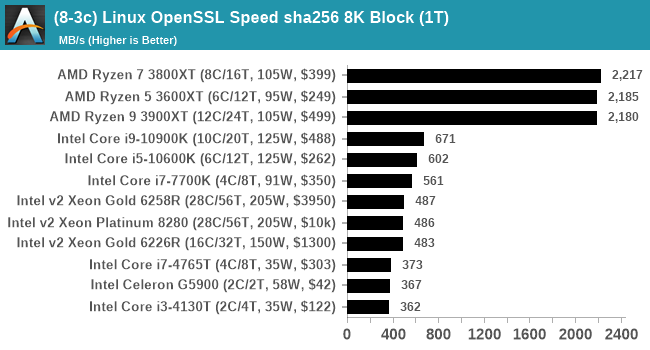
- sha256 at 8K block size
- md5 at 8K block size
For each of these tests, we run them in single thread and multithreaded mode.
To automate this test, Windows Subsystem for Linux is needed. For our last benchmark suite I scripted up enabling WSL with Ubuntu 18.04 on Windows in order to run SPEC, so that stays part of the suite (and actually now becomes the biggest pre-install of the suite).
OpenSSL speed has some commands to adjust the time of the test, however the way the script was managing it meant that it never seemed to work properly. However, the ability to adjust how many threads are in play does work, which is important for multithreaded testing.
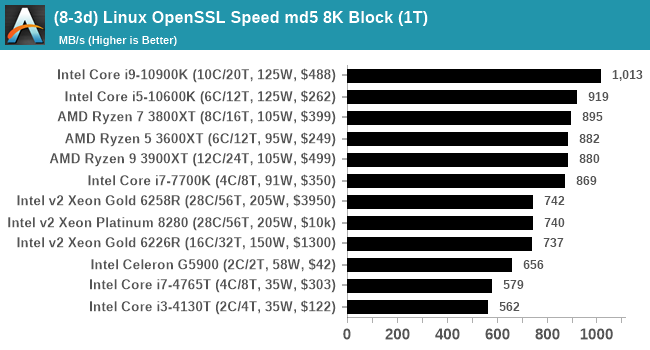
This test produces a lot of graphs, so for full reviews I might keep the rsa2048 ones and just leave the sha256/md5 data in Bench.
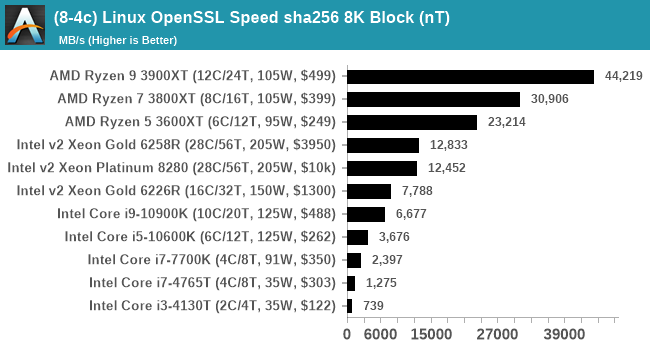

The AMD CPUs do really well in the sha256 test due to native support for SHA256 instructions.
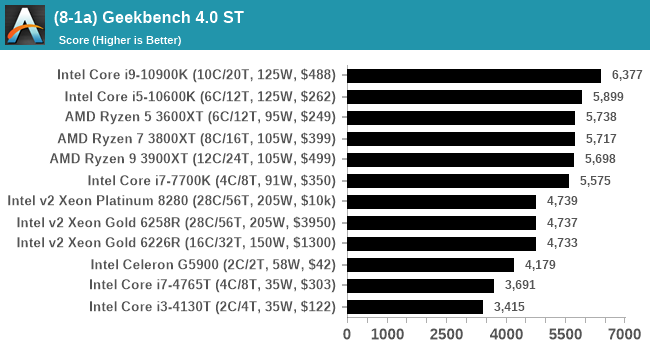
GeekBench 4: Link
As a common tool for cross-platform testing between mobile, PC, and Mac, GeekBench is an ultimate exercise in synthetic testing across a range of algorithms looking for peak throughput. Tests include encryption, compression, fast Fourier transform, memory operations, n-body physics, matrix operations, histogram manipulation, and HTML parsing.
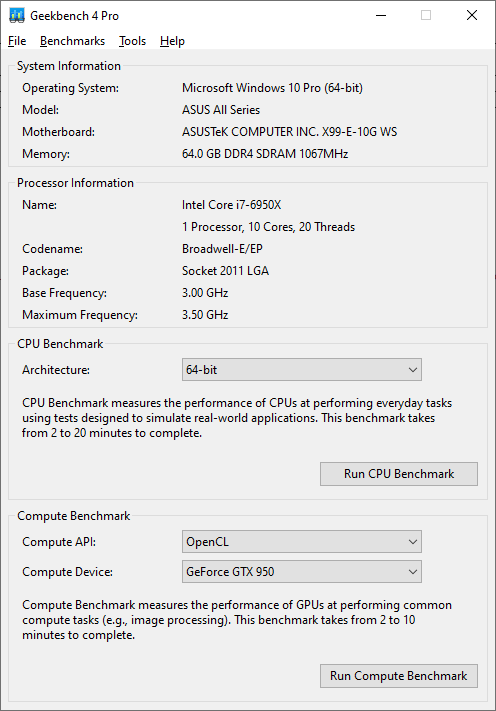
I’m including this test due to popular demand, although the results do come across as overly synthetic, and a lot of users often put a lot of weight behind the test due to the fact that it is compiled across different platforms (although with different compilers). Technically GeekBench 5 exists, however we do not have a key for the pro version that allows for command line processing.
For reviews we are posting the overall single and multi-threaded results.
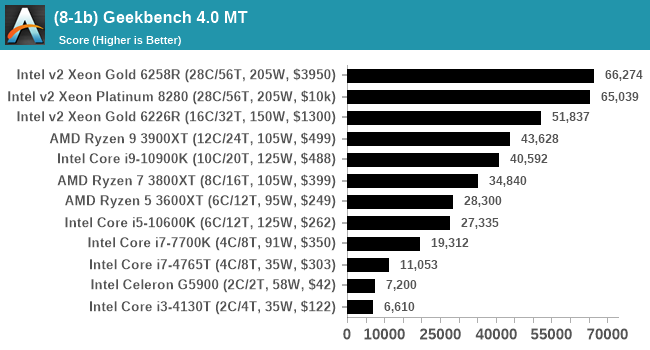
I have noticed that Geekbench 4 over Geekbench 5 does rely a lot on its memory subtests, which could play a factor if we have to test limited-access CPUs in different systems.
AIDA64 Memory Bandwidth: Link
Speaking of memory, one of the requests we have had is to showcase memory bandwidth. Lately AIDA64 has been doing some good work in providing automation access, so for this test I used the command line and some regex to extract the data from the JSON output. AIDA also provides screenshots of its testing windows as required.
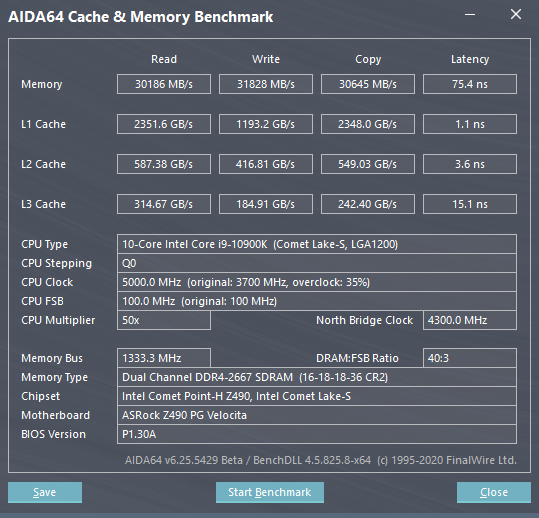
For the most part, we expect CPUs of the same family with the same memory support to not differ that much – there will be minor differences based on the exact frequency of the time, or how the power budget gets moved around, or how many cores are being fed by the memory at one time.
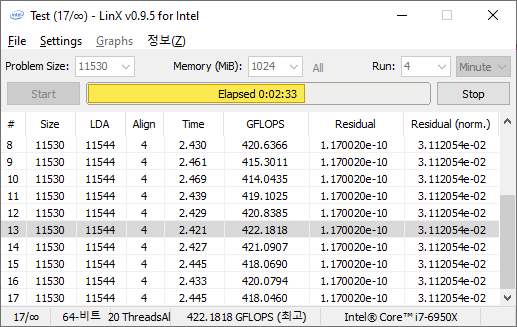
LinX 0.9.5 LINPACK
One of the benchmarks I’ve been after for a while is just something that outputs a very simple GFLOPs FP64 number, or in the case of AI I’d like to get a value for TOPs at a given level of quantization (FP32/FP16/INT8 etc). The most popular tool for doing this on supercomputers is a form of LINPACK, however for consumer systems it’s a case of making sure that the software is optimized for each CPU.
LinX has been a popular interface for LINPACK on Windows for a number of years. However the last official version was 0.6.5, launched in 2015, before the latest Ryzen hardware came into being. HWTips in Korea has been updating LinX and has separated out into two versions, one for Intel and one for AMD, and both have reached version 0.9.5. Unfortunately the AMD version is still a work in progress, as it doesn’t work on Zen 2.
There does exist a program called Linpack Extreme 1.1.3, which claims to be updated to use the latest version of the Intel Math Kernel Libraries. It works great, however the way the interface has been designed means that it can’t be automated for our uses, so we can’t use it.
For LinX 0.9.5, there also is a difficulty of what parameters to put into LINPACK. The two main parameters are problem size and time – choose a problem size too small, and you won’t get peak performance. Choose it too large, and the calculation can go on for hours. To that end, we use the following algorithms as a compromise:
- Memory Use = Floor(1000 + 20*sqrt(threads)) MB
- Time = Floor(10+sqrt(threads)) minutes
For a 4 thread system, we use 1040 MB and run for 12 minutes.
For a 128 thread system, we use 1226 MB and run for 21 minutes.
We take the peak value of GFLOPs by the output as a result. Unfortunately the output doesn’t come out in a clean UTF-8 regular output, which means this is one result we have to read direct from the results file.
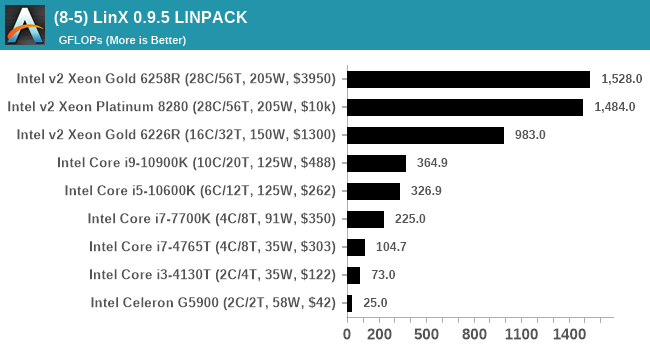
As we add in more CPUs, this graph should look more interesting. If a Zen2 version is deployed, we will adjust our script accordingly.


110 Comments
View All Comments
Smell This - Monday, July 20, 2020 - link
;- )
Oxford Guy - Monday, July 20, 2020 - link
"If there’s a CPU, old or new, you want to see tested, then please drop a comment below."• i7-3820. This one is especially interesting because it had roughly the same number of transistors as Piledriver on roughly the same node (Intel 32nm vs. GF 32 nm).
• 5775C
• 5675C (which outperformed and matched the 5775C in some games due to thermal throttling)
• 5775C with TDP bypassed or increased if this is possible, to avoid the aforementioned throttling
• I would really really like you to add Deserts of Kharak to your games test suite. It is the only game I know of that showed Piledriver beating Intel's chips. That unusual performance suggests that it was possible to get more performance out of Piledriver if developers targeted that CPU for optimization and/or the game's engine somehow simply suited it particularly.
• 8320E or 8370E at 4.7 GHz (non-turbo) with 2133 CAS 9-11-10 RAM, the most optimal Piledriver setup. The 9590 was not the most performant of the FX line, likely because of the turbo. A straight overclock coupled with tuned RAM (not 1600 CAS 10 nonsense) makes a difference. 4.7 GHz is a realistic speed achievable by a large AIO or small loop. If you want air cooling only then drop to 4.5 Ghz but keep the fast RAM. The point of testing this is to see what people were able to get in the real world from the AMD alternative for all the years they had to wait for Zen. Since we were stuck with Piledriver as the most performant Intel alternative for so so many years it's worth including for historical context. The "E" models don't have to be used but their lower leakage makes higher clocks less stressful on cooling than a 9000 series. 4.7 GHz was obtainable on a cheap motherboard like the Gigabyte UD3P, with strong airflow to the VRM sink.
• VIA's highest-performance model. If it won't work with Windows 10 then run the tests on it with 8.1. The thing is, though... VIA released an update fairly recently that should make it compatible with Windows 10. I saw Youtube footage of it gaming, in fact, with a discrete card. It really would be a refreshing thing to see VIA included, even though it's such a bit player.
• Lynnfield at 3 GHz.
• i7-9700K, of course.
Oxford Guy - Monday, July 20, 2020 - link
Regarding Deserts of Kharak... It may be that it took advantage of the extra cores. That would make it noteworthy also as an early example of a game that scaled to 8 threads.Oxford Guy - Monday, July 20, 2020 - link
Also, the Chinese X86 CPU, the one based on Zen 1, would be very nice to have included.Oxford Guy - Monday, July 20, 2020 - link
VIA CPUs tested with games as recently as 2019 (there was another video of the quad core but I didn't find it today with a quick search):https://www.youtube.com/watch?v=JPvKwqSMo-k
https://www.youtube.com/watch?v=Da0BkEW459E
The Zhaoxin KaiXian KX-U6880A would be nice to see included, not just the Chinese Zen 1 derivative.
Oxford Guy - Monday, July 20, 2020 - link
"due to thermal throttling"TDP throttling, to be more accurate. I suppose it could throttle due to current demand rather than temp.
axer1234 - Monday, July 20, 2020 - link
honestly i would love to know how different generation processor perform today especially higher core count. like prescott series pentium 4 athlon II phenomX6 core2 duo core2quad nehlam sandy bridge bulldozer etc with todays generation work loads and offeringin many scenario like word excel ppt photoshop it all works very well still in many offices
its just the new generation of application slowing it down for almost the same work etc
herefortheflops - Monday, July 20, 2020 - link
@Dr. Cutress.,As someone that has been dealing with similar or greater product testing challenges and configuration complexity for the better part of a decade or so, I would like to commend you for your ambitious goals and efforts so far. Additionally, I could be of high value to your effort if you are willing to discuss. I have reviewed in-depth the bench database (as well as competing websites) and I have come to the conclusion the Anandtech bench data is of very limited usefulness at present--and would require some significant changes to the data being collected/reported and the way things have been done to this point. I do understand where the industry is going, the questions the readers are going to be asking of the data, and the major comparisons that will be attempted with the data. Unfortunately, much of your effort may easily become irrelevant unless you proceed with some extreme caution to provide data with more utility. I also know methods to accomplish the desired result while reducing the size and cost of the task at hand. Reply by e-mail if you are interested in talking.
Best,
-A potential contributor to your effort.
Bensam123 - Tuesday, July 21, 2020 - link
Despite how impressive this is, one thing that hasn't been tackled is still multiplayer performance and it vastly changes recommendations for CPUs (doesn't effect GPUs as much).It goes from recommending a 6 core chip hands down to trying to make a case for 4 core chips still in this day and age. I own a 3900x and 2800 and I can tell you hands down Modern Warfare will gobble 70% of that 12 core chip, sometimes a bit more, that's equivalent to maxing out a 8 core of the same series. That vastly changes recommendations and data points. It's not just Modern Warfare. Overwatch, Black Ops 3(same engine as MW), and recently Hyper Scape will will make use of those extra cores. I have a widget to monitor CPU utilization in the background and I can check Task Manager. If I had a better video card I'm positive it would've sucked down even more of those 12 cores (my GPU is running at 100% load according to MSI AB).
This is a huge deal and while I understand, I get it, it's hard to reliably reproduce the same results in a multiplayer environment because it changes so much and generally seen as taboo from a hardware benchmarking standpoint, it is vastly different then singleplayer workloads to the point at which it requires completely different recommendations. Given how many people are making expensive hardware choices specifically because they play multiplayer games, I would even say most tech reviews in this day and age are irrelevant for CPU recommendations outside of the casual single player gamer. GPU recommendations are still very much on par, CPU is not remotely.
I talk about this frequently on my stream and why I still recommended the 1600 AF even when it was sitting at $105-125, it's a steal if you play multiplayer games, while most people that either read benchmarking websites or run benchmarks themselves will start making a case for a 4c Intel. 6 core is a must at the very least in this day and age.
Anandtech it's time to tread new ground and go into the uncharted area. Singleplayer results and multiplayer results are too different, you can't keep spinning the wheel and expect things to remain the same. You can verify this yourself just by running task manager in the background while playing one of the games I mentioned at the lowest settings regardless of being able to repeat those results exactly you'll see it's definitely a multi-core landscape for newer multiplayer games.
Not even touched on in the article.
Bensam123 - Tuesday, July 21, 2020 - link
70%, I have SMT off for clarification.