Launching the #CPUOverload Project: Testing Every x86 Desktop Processor since 2010
by Dr. Ian Cutress on July 20, 2020 1:30 PM ESTCPU Tests: SPEC2006 1T, SPEC2017 1T, SPEC2017 nT
SPEC2017 and SPEC2006 is a series of standardized tests used to probe the overall performance between different systems, different architectures, different microarchitectures, and setups. The code has to be compiled, and then the results can be submitted to an online database for comparison. It covers a range of integer and floating point workloads, and can be very optimized for each CPU, so it is important to check how the benchmarks are being compiled and run.
We run the tests in a harness built through Windows Subsystem for Linux, developed by our own Andrei Frumusanu. WSL has some odd quirks, with one test not running due to a WSL fixed stack size, but for like-for-like testing is good enough. SPEC2006 is deprecated in favor of 2017, but remains an interesting comparison point in our data. Because our scores aren’t official submissions, as per SPEC guidelines we have to declare them as internal estimates from our part.
For compilers, we use LLVM both for C/C++ and Fortan tests, and for Fortran we’re using the Flang compiler. The rationale of using LLVM over GCC is better cross-platform comparisons to platforms that have only have LLVM support and future articles where we’ll investigate this aspect more. We’re not considering closed-sourced compilers such as MSVC or ICC.
clang version 10.0.0
clang version 7.0.1 (ssh://git@github.com/flang-compiler/flang-driver.git
24bd54da5c41af04838bbe7b68f830840d47fc03)-Ofast -fomit-frame-pointer
-march=x86-64
-mtune=core-avx2
-mfma -mavx -mavx2
Our compiler flags are straightforward, with basic –Ofast and relevant ISA switches to allow for AVX2 instructions. We decided to build our SPEC binaries on AVX2, which puts a limit on Haswell as how old we can go before the testing will fall over. This also means we don’t have AVX512 binaries, primarily because in order to get the best performance, the AVX-512 intrinsic should be packed by a proper expert, as with our AVX-512 benchmark.
To note, the requirements for the SPEC licence state that any benchmark results from SPEC have to be labelled ‘estimated’ until they are verified on the SPEC website as a meaningful representation of the expected performance. This is most often done by the big companies and OEMs to showcase performance to customers, however is quite over the top for what we do as reviewers.
For each of the SPEC targets we are doing, SPEC2006 rate-1, SPEC2017 speed-1, and SPEC2017 speed-N, rather than publish all the separate test data in our reviews, we are going to condense it down into individual data points. The main three will be the geometric means from each of the three suites.

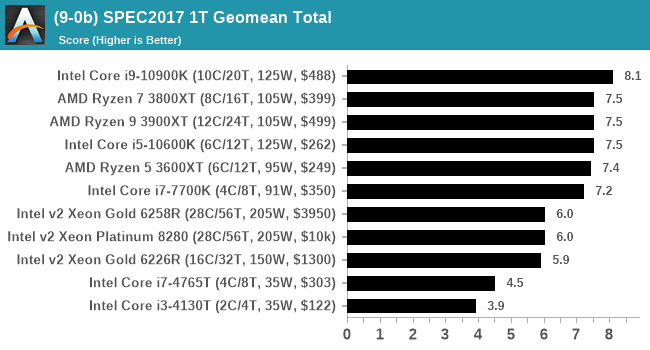
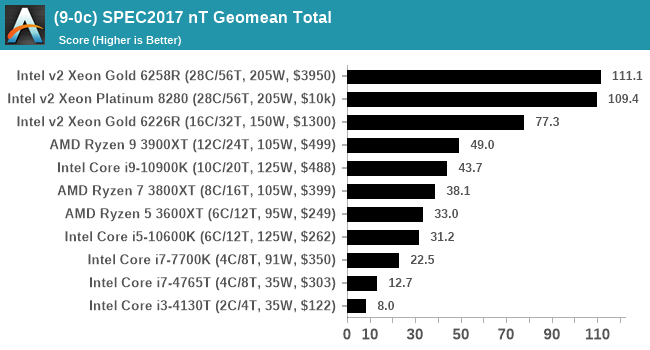
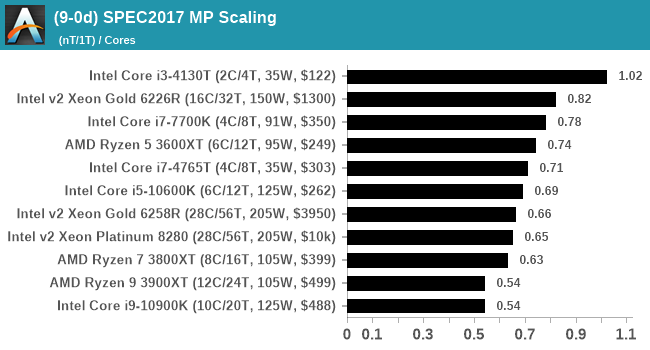
A fourth metric will be a scaling metric, indicating how well the nT result scales to the 1T result for 2017, divided by the number of cores on the chip.
The per-test data will be a part of Bench.
Experienced users should be aware that 521.wrf_r, part of the SPEC2017 suite, does not work in WSL due to the fixed stack size. It is expected to work with WSL2, however we will cross that bridge when we get to it. For now, we’re not giving wrf_r a score, which because we are taking the geometric mean rather than the average, should not affect the results too much.


110 Comments
View All Comments
DiHydro - Monday, July 20, 2020 - link
This is epic. Thank you for doing this.DiHydro - Monday, July 20, 2020 - link
To add a note: I think the ~$300 CPU year-over-year performance would be an interesting metric to see. That price point seems to be pretty popular for enthusiasts, and seeing back 5-6 years how that performance has increased per dollar would be neat.bldr - Monday, July 20, 2020 - link
Agree!close - Monday, July 20, 2020 - link
It will be especially interesting to see those CPUs (the popular mainstream ones) tested now and compared to the numbers they got originally to see how much they lost with all the recent mitigations.close - Tuesday, July 21, 2020 - link
Oh, because I forgot previously, congratulations and good luck with the endeavor! I got exhausted only by reading about the work you're going to have to doFozzie - Monday, July 20, 2020 - link
Except keep in mind that adjusted for inflation $200 in the year 2000 is worth over $300 now.You'd either be making a chart of the increased value over time just due to inflation or in fact the every increasing value at the $300 price point due to the reduced value of the Dollar on top of whatever performance gains occurred.
biosstar - Friday, July 24, 2020 - link
You could also use the value of a dollar in a certain year (let's say 2020) and compare the processors in the inflation adjusted equal categories.PeterCollier - Monday, July 20, 2020 - link
What's the point of this Geekbench/Userbenchmark knockoff? I've never used AT's Bench tool. Especially not for smartphones, since the Bench tool is about 5 years out of date.BushLin - Monday, July 20, 2020 - link
A controlled environment across all tests is reason enough. Even if I don't agree with AT policy on what speed they allow RAM to operate, it is a fair comparison.Byte - Monday, July 20, 2020 - link
RAM is a really important topic. I think at this point in time, we can reasonable put almost maxed out ram for every platform. Like DDR3 can run at 2133, DDR4 we can run it at 3200 as prices are so close.It is like rating sports cars but all have Goodride tires on them.
A dodge viper was a widowmaker when it came out. Today with a good set of summers like PS4S or PZero, you will have a hard time slipping even if you tried.