Launching the #CPUOverload Project: Testing Every x86 Desktop Processor since 2010
by Dr. Ian Cutress on July 20, 2020 1:30 PM ESTCPU Tests: Microbenchmarks
There is a class of synthetic tests which are valid - these tests are designed to probe the system underneath to find out how it works, rather than focusing on performance. As part of our test suite, these benchmarks are run for the sake of us having insights into the data, however this data isn’t in a form that we can transcribe into Bench, but it will certainly be part of reviews into how each different microarchitecture is evolving. Sometimes these tests are called ‘Microbenchmarks’, however some of our tests are more than that.
Full x86 Instruction Throughput/Latency Analysis
The full version of one of the software packages we use has a tool in order to be able to test every single x86 and x64 instruction that is in the official documentation, along with variants of those instructions. Our full instruction test goes through all of them, including x87 and the latest AVX-512, to see what works and how performant they are.
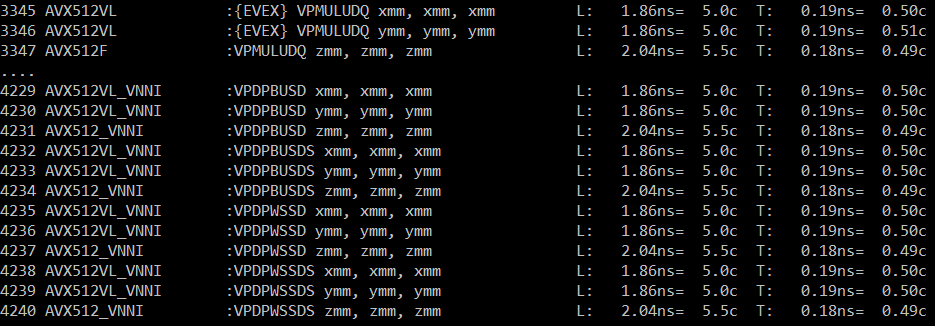
For this benchmark, we acquired a command line version. There is a secondary caveat, and that it requires turbo to be disabled – luckily we can do that on the command line as well.
Core-to-Core Latency
As the core count of modern CPUs is growing, we are reaching a time when the time to access each core from a different core is no longer a constant. Even before the advent of heterogeneous SoC designs, processors built on large rings or meshes can have different latencies to access the nearest core compared to the furthest core. This rings true especially in multi-socket server environments.
But modern CPUs, even desktop and consumer CPUs, can have variable access latency to get to another core. For example, in the first generation Threadripper CPUs, we had four chips on the package, each with 8 threads, and each with a different core-to-core latency depending on if it was on-die or off-die. This gets more complex with products like Lakefield, which has two different communication buses depending on which core is talking to which.
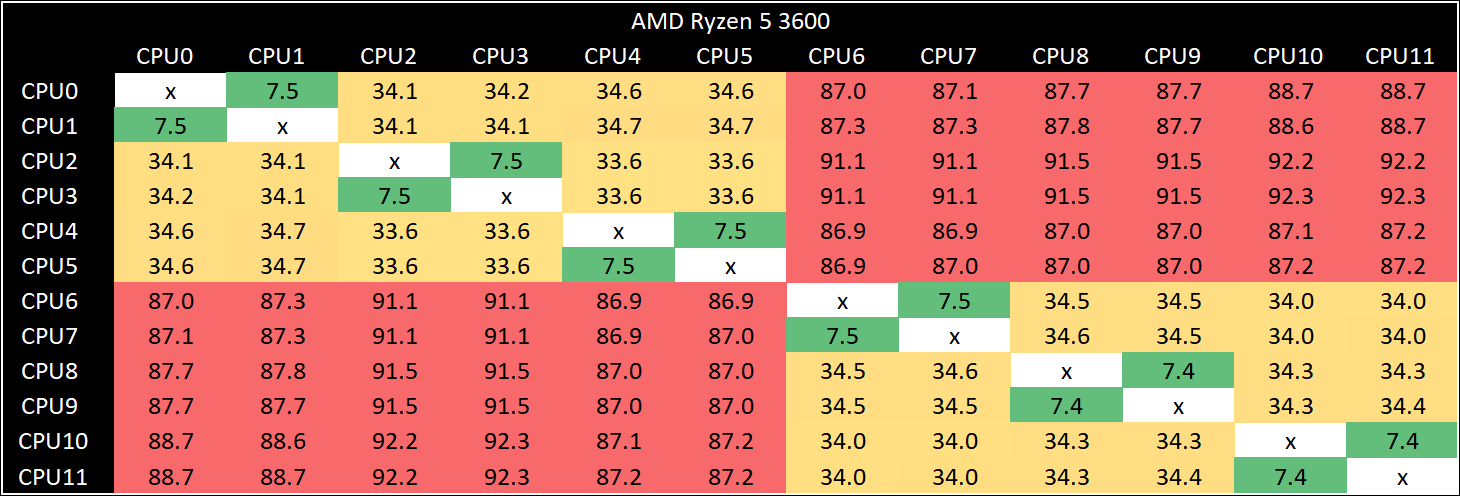
If you are a regular reader of AnandTech’s CPU reviews, you will recognize our Core-to-Core latency test. It’s a great way to show exactly how groups of cores are laid out on the silicon. This is a custom in-house test built by Andrei, and we know there are competing tests out there, but we feel ours is the most accurate to how quick an access between two cores can happen.
There is one caveat, and that’s the danger of putting too much emphasis on the comparative values. These are latency values, and in terms of performance, only particularly relevant if a workload is core-to-core latency sensitive. There are always plenty of other elements in play, such as prefetchers and buffers, which likely matter more to performance.
Cache-to-DRAM Latency
This is another in-house test built by Andrei, which showcases the access latency at all the points in the cache hierarchy for a single core. We start at 2 KiB, and probe the latency all the way through to 256 MB, which for most CPUs sits inside the DRAM (before you start saying 64-core TR has 256 MB of L3, it’s only 16 MB per core, so at 20 MB you are in DRAM).
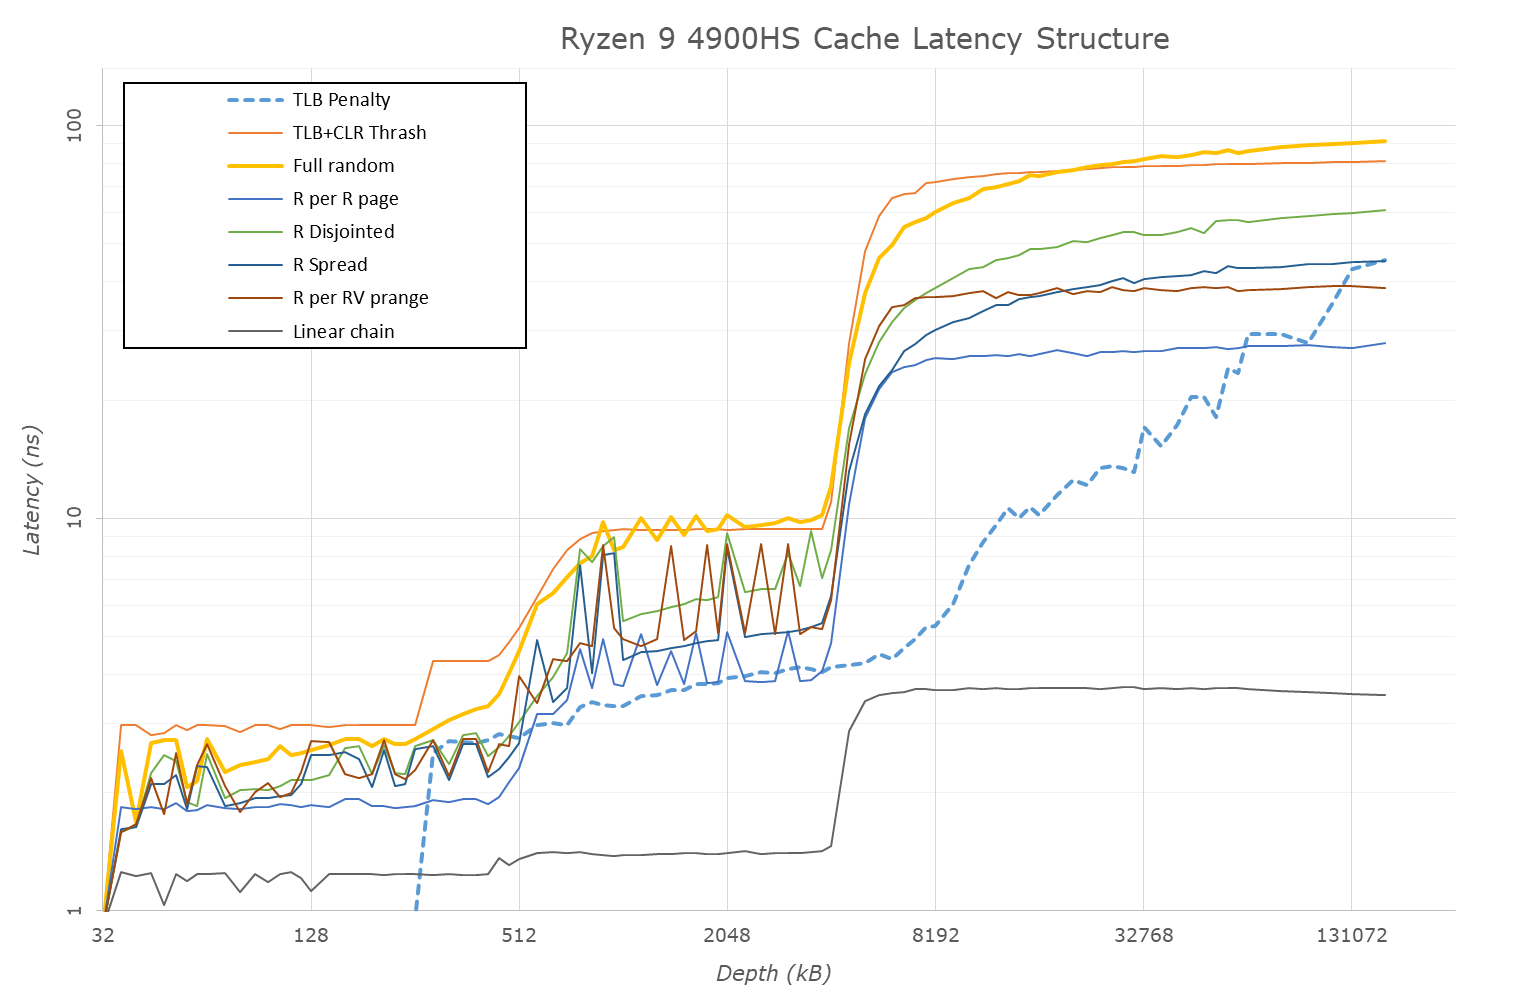
Part of this test helps us understand the range of latencies for accessing a given level of cache, but also the transition between the cache levels gives insight into how different parts of the cache microarchitecture work, such as TLBs. As CPU microarchitects look at interesting and novel ways to design caches upon caches inside caches, this basic test should prove to be very valuable.
Frequency Ramping
Both AMD and Intel over the past few years have introduced features to their processors that speed up the time from when a CPU moves from idle into a high powered state. The effect of this means that users can get peak performance quicker, but the biggest knock-on effect for this is with battery life in mobile devices, especially if a system can turbo up quick and turbo down quick, ensuring that it stays in the lowest and most efficient power state for as long as possible.
Intel’s technology is called SpeedShift, while AMD has CPPC2.
One of the issues though with this technology is that sometimes the adjustments in frequency can be so fast, software cannot detect them. If the frequency is changing on the order of microseconds, but your software is only probing frequency in milliseconds (or seconds), then quick changes will be missed. Not only that, as an observer probing the frequency, you could be affecting the actual turbo performance. When the CPU is changing frequency, it essentially has to pause all compute while it aligns the frequency rate of the whole core.
We wrote an extensive review analysis piece on this, called ‘Reaching for Turbo: Aligning Perception with AMD’s Frequency Metrics’, due to an issue where users were not observing the peak turbo speeds for AMD’s processors.
We got around the issue, again due to another fabulous Andrei tool, by making the frequency probing the workload causing the turbo. The software is able to detect frequency adjustments on a microsecond scale, so we can see how well a system can get to those boost frequencies.
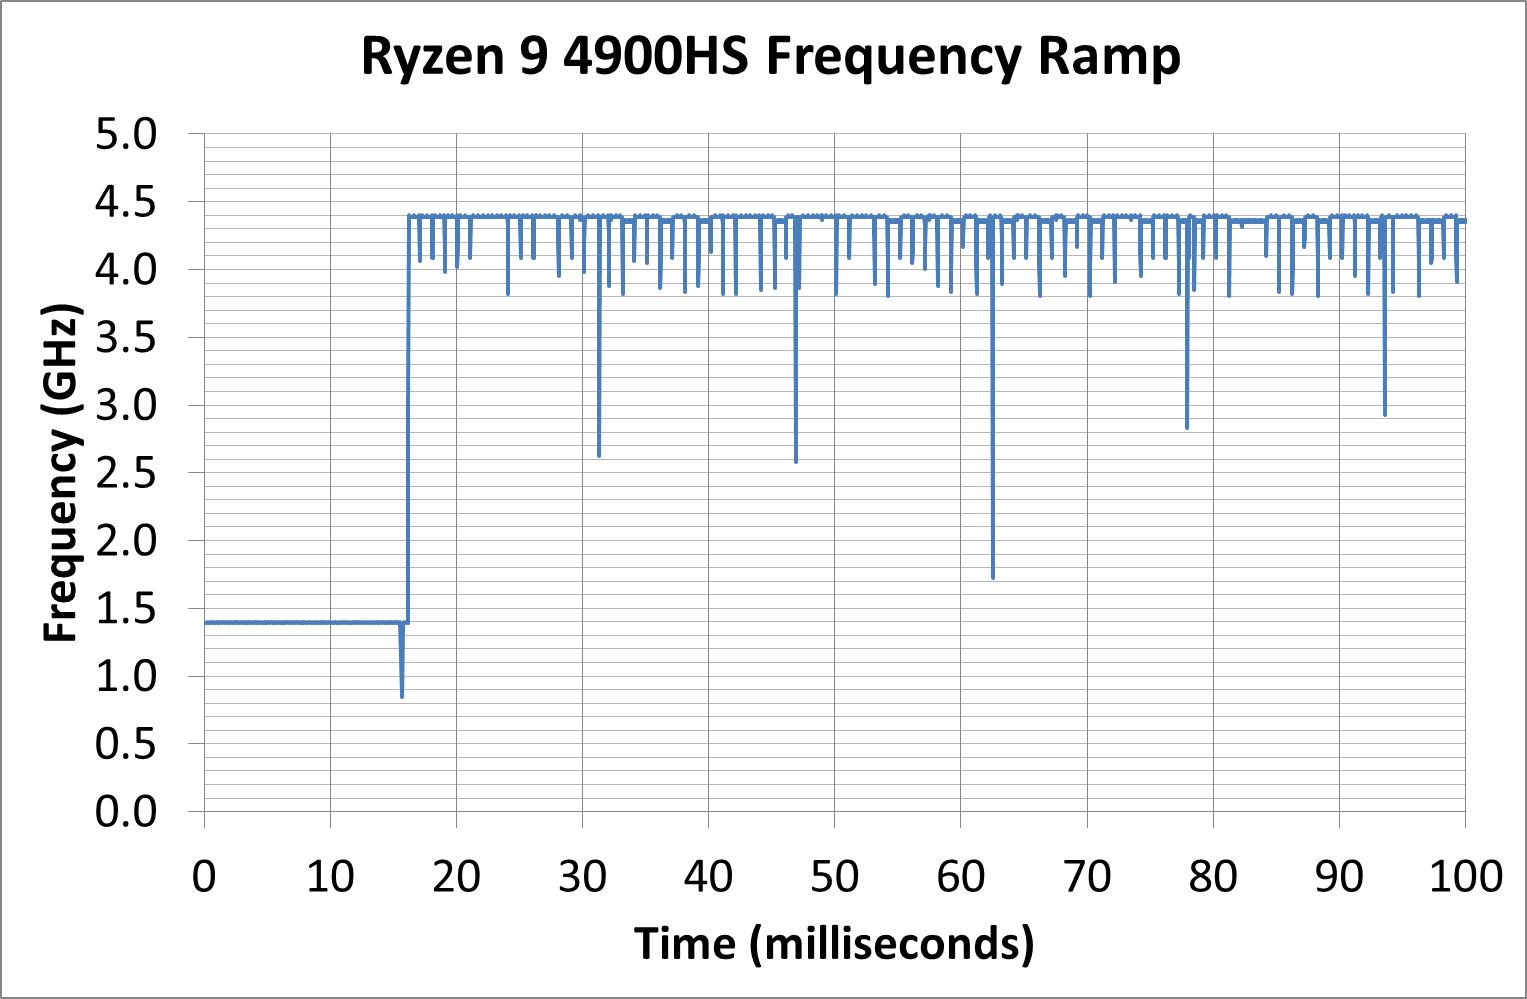
Our Frequency Ramp tool has already been in use in a number of reviews. Currently we’re seeing most Intel and AMD CPUs aim for a 16.6 ms idle-to-turbo scale, which equates to a single frame on a 60 Hz display – this is often enough for most user interaction situations.
A y-Cruncher Sprint
This last test is somewhat for my own edification. The y-cruncher website has a large about of benchmark data showing how different CPUs perform to calculate specific values of pi. Below these there are a few CPUs where it shows the time to compute moving from 25 million digits to 50 million, 100 million, 250 million, and all the way up to 10 billion, to showcase how the performance scales with digits (assuming everything is in memory).
This range of results, from 25 million to 250 billion, is something I’ve dubbed a ‘sprint’.
You might notice that not all of the cells are filled, and that is because as we move into the billions, the systems have to have 16/32/64 of memory or more in order to even attempt the task. Moreover, there is no element of consistency in the data – it’s all from a variety of places using different memory.
In order to get a complete set of data, I have written some code in order to perform a sprint on every CPU we test. It detects the DRAM, works out the biggest value that can be calculated with that amount of memory, and works up from 25 million digits. For the tests that go up to the ~25 billion digits, it only adds an extra 15 minutes to the suite for an 8-core Ryzen CPU.


110 Comments
View All Comments
29a - Monday, July 20, 2020 - link
Please remove Egomark from the benchmark list.Meteor2 - Monday, August 3, 2020 - link
Why?Mr Perfect - Monday, July 20, 2020 - link
Reading through the OS preparation section, I kind of wonder if setting up a domain would be helpful?Joining a test PC to a domain would allow all of those settings to be configured through GPO instead of running tons of batch files and scripts. You'd also gain the ability to point Windows Update at a WSUS server, where you control what updates are even shown to the PC (in your case, probably none). Throw in the ability to remotely run scripts with Domain Administrator accounts, and you could probably skip around those UAC prompts too.
It would be a lot of setup the first time around, but it does point to that automation-eventually-pays-off thing.
Icehawk - Monday, July 20, 2020 - link
Very cool!Would like to see your handbrake HEVC encoding done via software with no vendor encoder - it’s the only way you guys can be getting those crazy fps numbers. I don’t want to see how a vendor encoder runs, I want to see how the CPU runs - and those hardware ones are still worse than software so I do not use them even though it is a massive speed boost.
extide - Monday, July 20, 2020 - link
Using vector instructions like AVX is still "software" encoding. It's fully CPU, and not at all a lower quality hardware encoder.faizoff - Monday, July 20, 2020 - link
Until I upgraded from an HD 6870 to an RX 580 recently I had no idea GPUs had dedicated encoders. I've tried them and they are definitely faster than the CPU, the same file that I tried got well over 40 fps compared to the 5 fps when choosing the CPU encoder.The caveat was that the GPU encoded files were much larger in size with comparable quality.
lmcd - Tuesday, July 21, 2020 - link
There's ways to push file size back down afaik.Meteor2 - Monday, August 3, 2020 - link
Not with hardware encoding.jaminvi - Monday, July 20, 2020 - link
Looks great from here. Good cross section of test. Looking forward to it.catavalon21 - Monday, July 20, 2020 - link
This is outstanding. Very much like the stuff on this site back in this site's early days, like comparing Pentium performance with and without MMX. Comparing the performance between VX and HX chipsets. Tip of the hat, old man.