Launching the #CPUOverload Project: Testing Every x86 Desktop Processor since 2010
by Dr. Ian Cutress on July 20, 2020 1:30 PM ESTCPU Tests: Synthetic
Most of the people in our industry have a love/hate relationship when it comes to synthetic tests. On the one hand, they’re often good for quick summaries of performance and are easy to use, but most of the time the tests aren’t related to any real software. Synthetic tests are often very good at burrowing down to a specific set of instructions and maximizing the performance out of those. Due to requests from a number of our readers, we have the following synthetic tests.
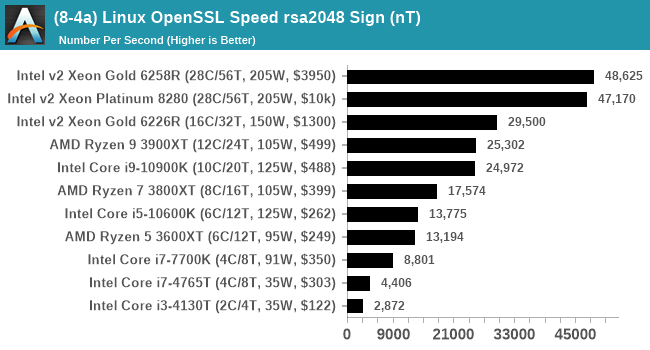
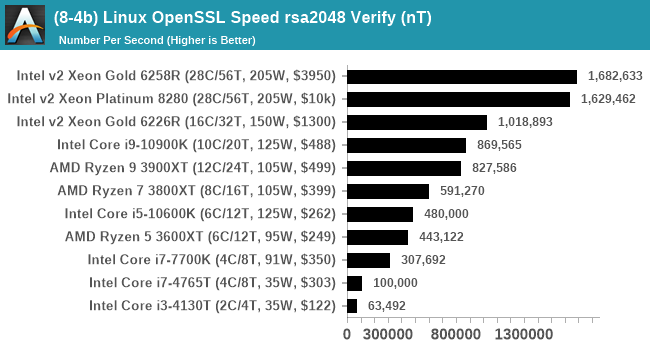
Linux OpenSSL Speed
In our last review, and on my twitter, I opined about potential new benchmarks for our suite. One of our readers reached out to me and stated that he was interested in looking at OpenSSL hashing rates in Linux. Luckily OpenSSL in Linux has a function called ‘speed’ that allows the user to determine how fast the system is for any given hashing algorithm, as well as signing and verifying messages.
OpenSSL offers a lot of algorithms to choose from, and based on a quick Twitter poll, we narrowed it down to the following:
- rsa2048 sign and rsa2048 verify
- sha256 at 8K block size
- md5 at 8K block size
For each of these tests, we run them in single thread and multithreaded mode.
To automate this test, Windows Subsystem for Linux is needed. For our last benchmark suite I scripted up enabling WSL with Ubuntu 18.04 on Windows in order to run SPEC, so that stays part of the suite (and actually now becomes the biggest pre-install of the suite).
OpenSSL speed has some commands to adjust the time of the test, however the way the script was managing it meant that it never seemed to work properly. However, the ability to adjust how many threads are in play does work, which is important for multithreaded testing.
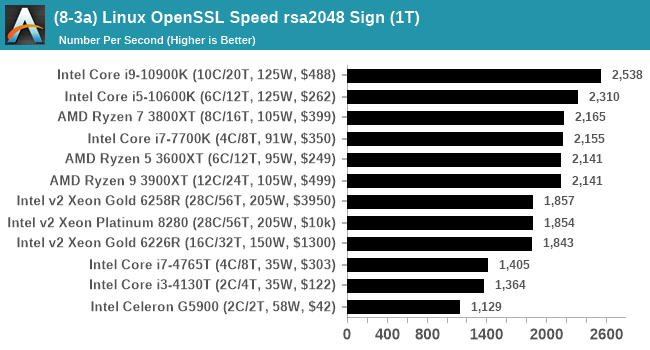
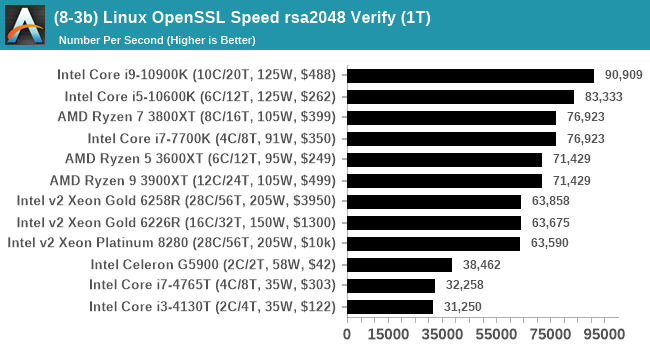
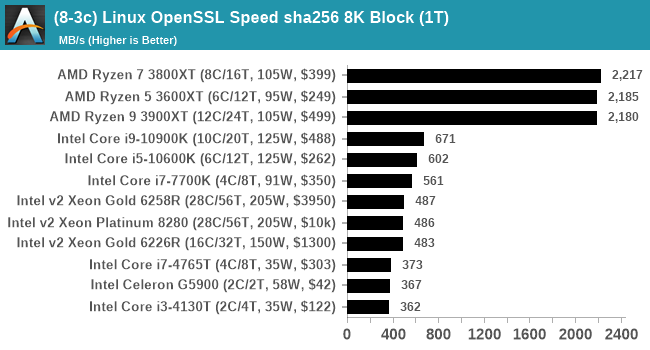
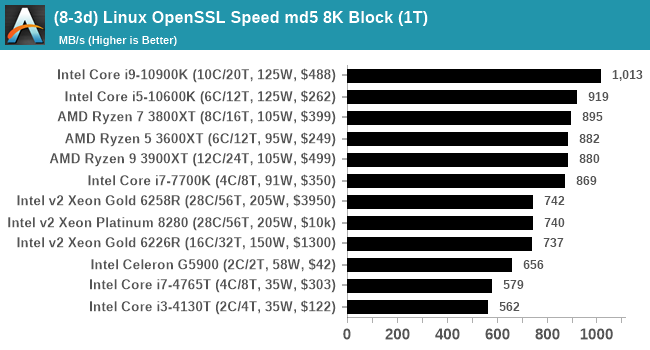
This test produces a lot of graphs, so for full reviews I might keep the rsa2048 ones and just leave the sha256/md5 data in Bench.
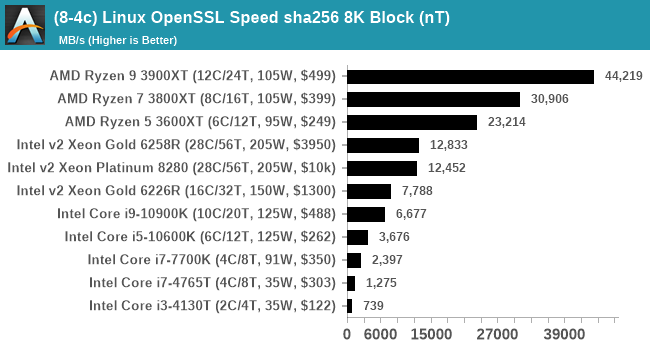

The AMD CPUs do really well in the sha256 test due to native support for SHA256 instructions.
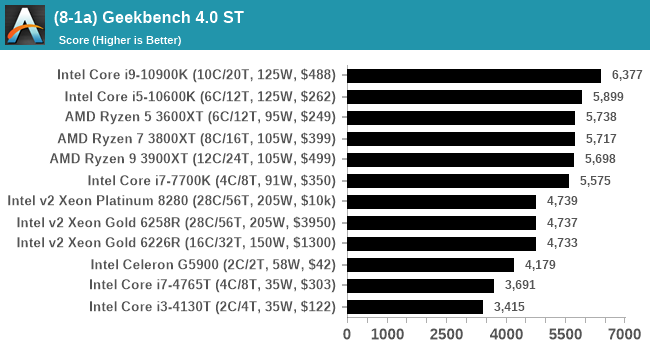
GeekBench 4: Link
As a common tool for cross-platform testing between mobile, PC, and Mac, GeekBench is an ultimate exercise in synthetic testing across a range of algorithms looking for peak throughput. Tests include encryption, compression, fast Fourier transform, memory operations, n-body physics, matrix operations, histogram manipulation, and HTML parsing.
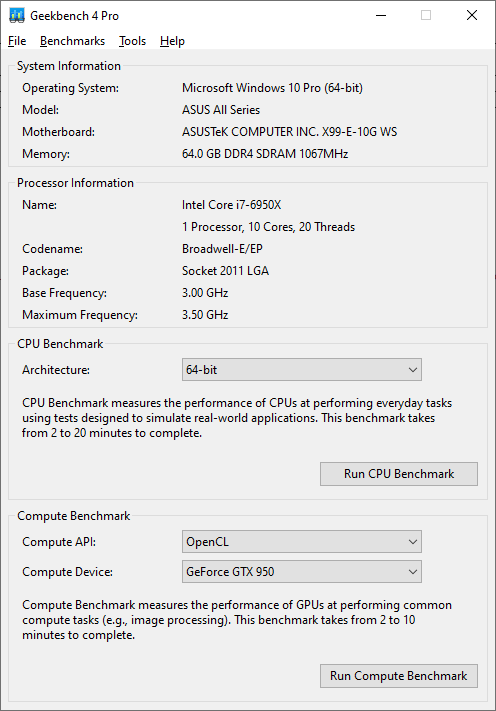
I’m including this test due to popular demand, although the results do come across as overly synthetic, and a lot of users often put a lot of weight behind the test due to the fact that it is compiled across different platforms (although with different compilers). Technically GeekBench 5 exists, however we do not have a key for the pro version that allows for command line processing.
For reviews we are posting the overall single and multi-threaded results.
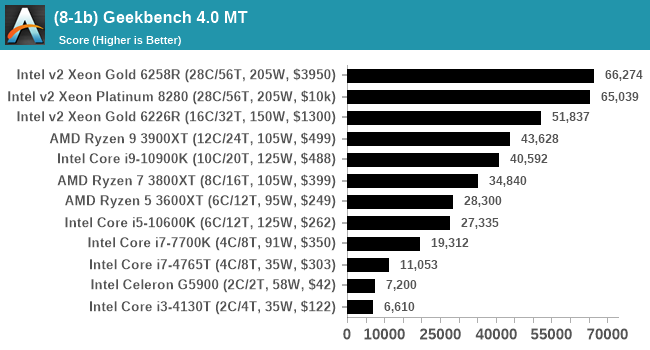
I have noticed that Geekbench 4 over Geekbench 5 does rely a lot on its memory subtests, which could play a factor if we have to test limited-access CPUs in different systems.
AIDA64 Memory Bandwidth: Link
Speaking of memory, one of the requests we have had is to showcase memory bandwidth. Lately AIDA64 has been doing some good work in providing automation access, so for this test I used the command line and some regex to extract the data from the JSON output. AIDA also provides screenshots of its testing windows as required.
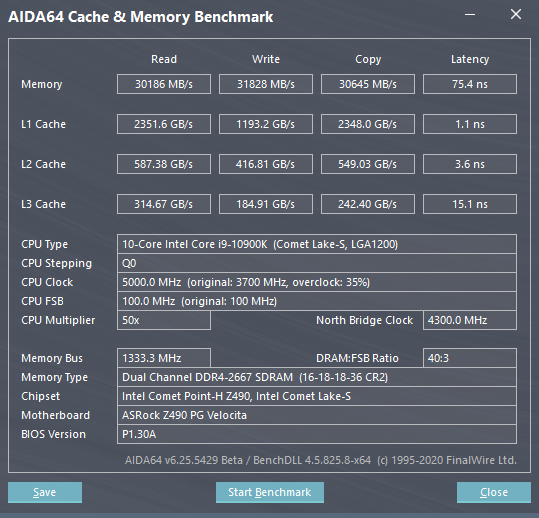
For the most part, we expect CPUs of the same family with the same memory support to not differ that much – there will be minor differences based on the exact frequency of the time, or how the power budget gets moved around, or how many cores are being fed by the memory at one time.
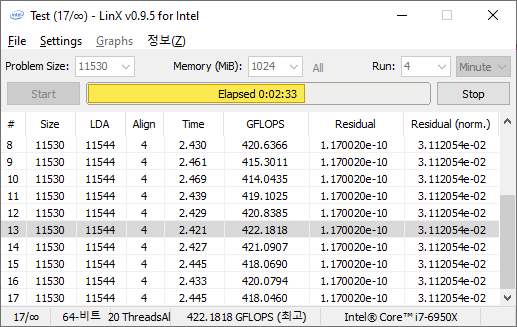
LinX 0.9.5 LINPACK
One of the benchmarks I’ve been after for a while is just something that outputs a very simple GFLOPs FP64 number, or in the case of AI I’d like to get a value for TOPs at a given level of quantization (FP32/FP16/INT8 etc). The most popular tool for doing this on supercomputers is a form of LINPACK, however for consumer systems it’s a case of making sure that the software is optimized for each CPU.
LinX has been a popular interface for LINPACK on Windows for a number of years. However the last official version was 0.6.5, launched in 2015, before the latest Ryzen hardware came into being. HWTips in Korea has been updating LinX and has separated out into two versions, one for Intel and one for AMD, and both have reached version 0.9.5. Unfortunately the AMD version is still a work in progress, as it doesn’t work on Zen 2.
There does exist a program called Linpack Extreme 1.1.3, which claims to be updated to use the latest version of the Intel Math Kernel Libraries. It works great, however the way the interface has been designed means that it can’t be automated for our uses, so we can’t use it.
For LinX 0.9.5, there also is a difficulty of what parameters to put into LINPACK. The two main parameters are problem size and time – choose a problem size too small, and you won’t get peak performance. Choose it too large, and the calculation can go on for hours. To that end, we use the following algorithms as a compromise:
- Memory Use = Floor(1000 + 20*sqrt(threads)) MB
- Time = Floor(10+sqrt(threads)) minutes
For a 4 thread system, we use 1040 MB and run for 12 minutes.
For a 128 thread system, we use 1226 MB and run for 21 minutes.
We take the peak value of GFLOPs by the output as a result. Unfortunately the output doesn’t come out in a clean UTF-8 regular output, which means this is one result we have to read direct from the results file.
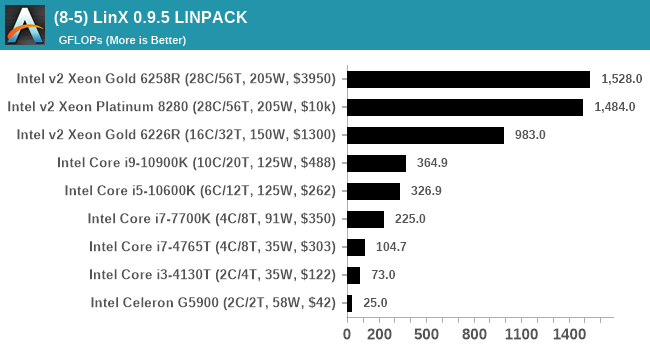
As we add in more CPUs, this graph should look more interesting. If a Zen2 version is deployed, we will adjust our script accordingly.


110 Comments
View All Comments
PeachNCream - Tuesday, July 21, 2020 - link
You don't get what it means to perform a controlled test do you?Aspernari - Wednesday, July 22, 2020 - link
It's important to note that the environment is not actually well-controlled.https://twitter.com/IanCutress/status/128480609693...
We don't know temperature for the operating conditions for these tests, which matters more and more for boost behavior for CPUs and GPUs. He says 36c when he got into the office, we'll never know what the temperature peaked at, nor how often similar conditions were reached.
A standard platform is a good choice, but a controlled environment is also important. Unfortunately, the results aren't as reliable as they otherwise might have been.
PeterCollier - Wednesday, July 22, 2020 - link
And that's why this entire test is a complete waste of time. Something like Geekbench or especially Userbench is much, much better because it gives you a range of scores. Instead of trying to create false precision by saying that a AMD 4700U scored, say, a "979" on a benchmark, Userbench will say that all the 4700U's tested scored from 899 to 1008, and break it down into percentiles. This way, you have a range of expected performance in mind instead of being fixated on that "979" number, which could have been obtained in an unrealistic scenario.Rudde - Saturday, July 25, 2020 - link
Isn't userbench a synthetic together with geekbench? What exactly are they testing? Instead of knowing which of Intel i7 10700k and AMD ryzen 7 3800X is better at rendering, video encoding, number crunching or whatever your use case is, you'll get a distribution based on a largely unknown test. The Intel and AMD processors might end up being within error margins of each other in your use case, but that in itself tells something too. All benchmarks are inherently bad; there is not a single benchmark that captures every use case while not being affected by its environment (ram speeds, temperatures, etc). I prefer tests that I understand, over tests that I do not understand.bananaforscale - Wednesday, July 22, 2020 - link
One could ask what the point of Userbenchmark is in these days of quadcores being basically entry level while the benchmark has DECREASED its multicore weighting.A5 - Monday, July 20, 2020 - link
For my own personal test, getting an i7-4770K in the list would be a big help.Once you have a compile test, a Xeon E5-1680v3 would be nice to see so that I can sell my corp on newer workstations...
Shmee - Wednesday, July 22, 2020 - link
Those are great Haswell EP CPUs, and they OC too! I have an E5-1660v3 in my X99 rig.Mockingtruth - Monday, July 20, 2020 - link
I have a 3570k and a E8600 spare with respective motherboards and ram if useful?CampGareth - Monday, July 20, 2020 - link
Personally I'd like to see a Xeon E5-2670 v1 benchmarked. I'm still running a pair of them as my workstation but these days AMD can beat the performance on a single socket and halve the power consumption.Samus - Tuesday, July 21, 2020 - link
Do you run them in an HP Z620? I ran the same system with the same CPU’s for years at one of my clients. What a beast.