Launching the #CPUOverload Project: Testing Every x86 Desktop Processor since 2010
by Dr. Ian Cutress on July 20, 2020 1:30 PM ESTCPU Tests: Legacy and Web
In order to gather data to compare with older benchmarks, we are still keeping a number of tests under our ‘legacy’ section. This includes all the former major versions of CineBench (R15, R11.5, R10) as well as x264 HD 3.0 and the first very naïve version of 3DPM v2.1. We won’t be transferring the data over from the old testing into Bench, otherwise it would be populated with 200 CPUs with only one data point, so it will fill up as we test more CPUs like the others.
The other section here is our web tests.
Web Tests: Kraken, Octane, and Speedometer
Benchmarking using web tools is always a bit difficult. Browsers change almost daily, and the way the web is used changes even quicker. While there is some scope for advanced computational based benchmarks, most users care about responsiveness, which requires a strong back-end to work quickly to provide on the front-end. The benchmarks we chose for our web tests are essentially industry standards – at least once upon a time.
It should be noted that for each test, the browser is closed and re-opened a new with a fresh cache. We use a fixed Chromium version for our tests with the update capabilities removed to ensure consistency.
Mozilla Kraken 1.1
Kraken is a 2010 benchmark from Mozilla and does a series of JavaScript tests. These tests are a little more involved than previous tests, looking at artificial intelligence, audio manipulation, image manipulation, json parsing, and cryptographic functions. The benchmark starts with an initial download of data for the audio and imaging, and then runs through 10 times giving a timed result.
Automation involves loading the direct webpage where the test is run and putting it through. All CPUs finish the test in under a couple of minutes, so we put that as the end point and copy the page contents into the clipboard before parsing the result. Each run of the test on most CPUs takes from half-a-second to a few seconds
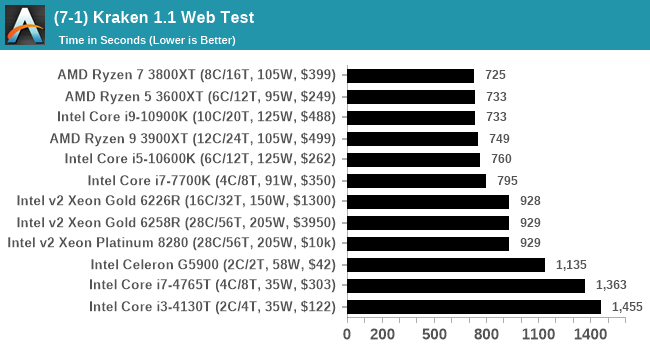
We loop through the 10-run test four times (so that’s a total of 40 runs), and average the four end-results. The result is given as time to complete the test, and we’re reaching a slow asymptotic limit with regards the highest IPC processors.
Google Octane 2.0
Our second test is also JavaScript based, but uses a lot more variation of newer JS techniques, such as object-oriented programming, kernel simulation, object creation/destruction, garbage collection, array manipulations, compiler latency and code execution.
Octane was developed after the discontinuation of other tests, with the goal of being more web-like than previous tests. It has been a popular benchmark, making it an obvious target for optimizations in the JavaScript engines. Ultimately it was retired in early 2017 due to this, although it is still widely used as a tool to determine general CPU performance in a number of web tasks.
Octane’s automation is a little different than the others: there is no direct website to go to in order to run the benchmark. The benchmark page is opened, but the user has to navigate to the ‘start’ button or open the console and initiate the JavaScript required to run the test. The test also does not show an obvious end-point, but luckily does try and aim for a fixed time for each processor. This is similar to some of our other tests, that loop around a fixed time before ending. Unfortunately this doesn’t work if the first loop goes beyond that fixed time, as the loop still has to finish. For Octane, we have set it to 75 seconds per run, and we loop the whole test four times.
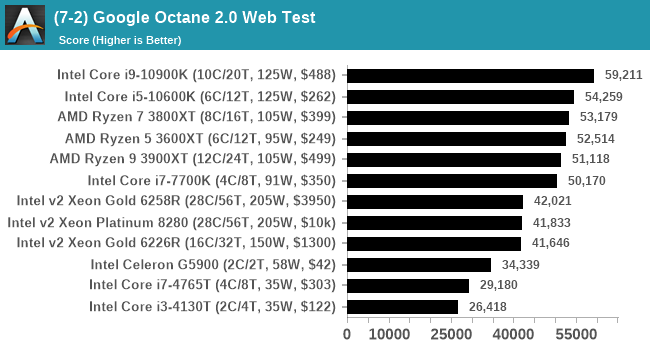
It is worth noting that in the last couple of Intel generations, there was a significant uptick in performance for Intel, likely due to one of the optimizations from the code base that filtered through into the microarchitecture. Octane is still an interesting comparison point for systems within a similar microarchitecture scope.
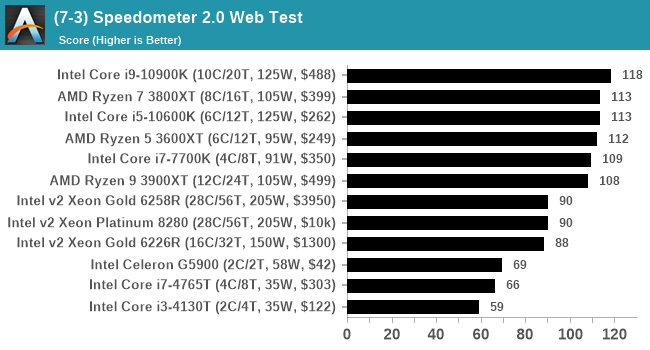
Speedometer 2: JavaScript Frameworks
Our newest web test is Speedometer 2, which is a test over a series of JavaScript frameworks to do three simple things: built a list, enable each item in the list, and remove the list. All the frameworks implement the same visual cues, but obviously apply them from different coding angles.
Our test goes through the list of frameworks, and produces a final score indicative of ‘rpm’, one of the benchmarks internal metrics. Rather than use the main interface, we go to the admin interface through the about page and manage the results there. It involves saving the webpage when the test is complete and parsing the final result.
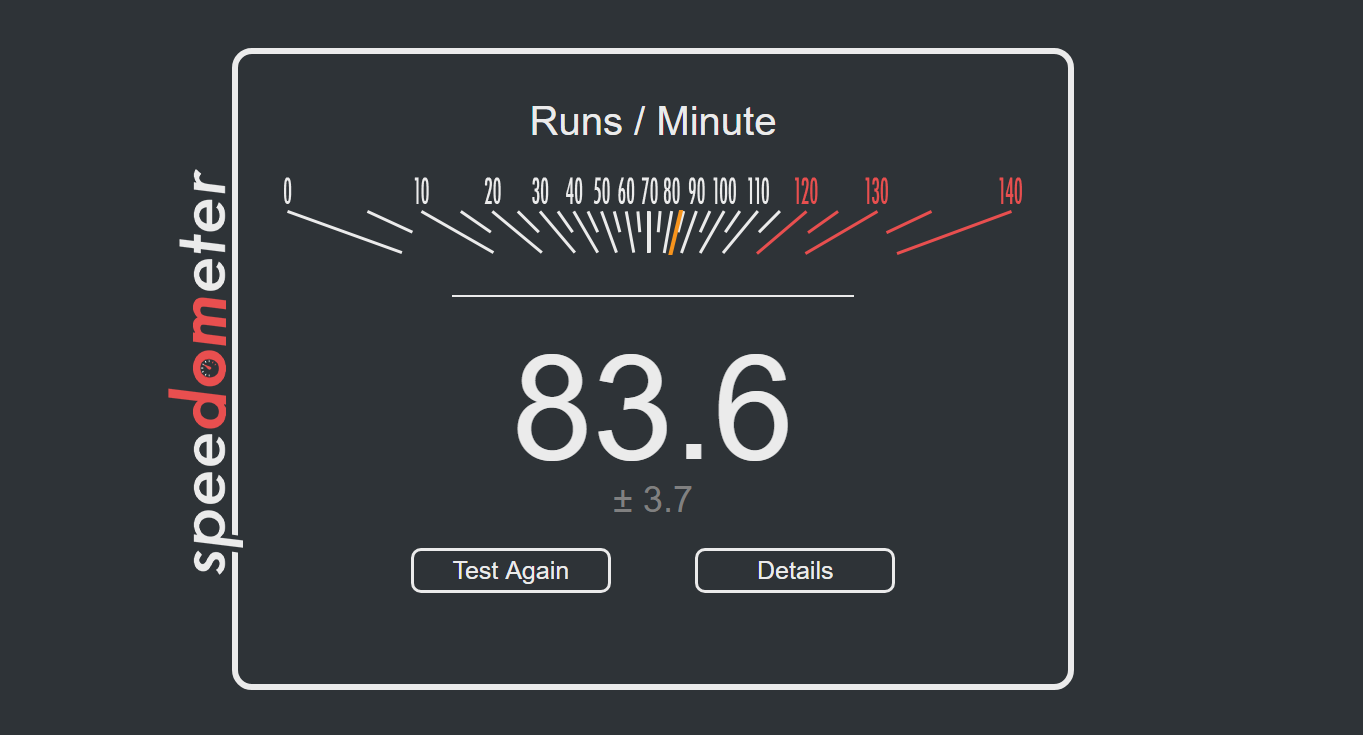
We repeat over the benchmark for a dozen loops, taking the average of the last five.


110 Comments
View All Comments
PeachNCream - Tuesday, July 21, 2020 - link
You don't get what it means to perform a controlled test do you?Aspernari - Wednesday, July 22, 2020 - link
It's important to note that the environment is not actually well-controlled.https://twitter.com/IanCutress/status/128480609693...
We don't know temperature for the operating conditions for these tests, which matters more and more for boost behavior for CPUs and GPUs. He says 36c when he got into the office, we'll never know what the temperature peaked at, nor how often similar conditions were reached.
A standard platform is a good choice, but a controlled environment is also important. Unfortunately, the results aren't as reliable as they otherwise might have been.
PeterCollier - Wednesday, July 22, 2020 - link
And that's why this entire test is a complete waste of time. Something like Geekbench or especially Userbench is much, much better because it gives you a range of scores. Instead of trying to create false precision by saying that a AMD 4700U scored, say, a "979" on a benchmark, Userbench will say that all the 4700U's tested scored from 899 to 1008, and break it down into percentiles. This way, you have a range of expected performance in mind instead of being fixated on that "979" number, which could have been obtained in an unrealistic scenario.Rudde - Saturday, July 25, 2020 - link
Isn't userbench a synthetic together with geekbench? What exactly are they testing? Instead of knowing which of Intel i7 10700k and AMD ryzen 7 3800X is better at rendering, video encoding, number crunching or whatever your use case is, you'll get a distribution based on a largely unknown test. The Intel and AMD processors might end up being within error margins of each other in your use case, but that in itself tells something too. All benchmarks are inherently bad; there is not a single benchmark that captures every use case while not being affected by its environment (ram speeds, temperatures, etc). I prefer tests that I understand, over tests that I do not understand.bananaforscale - Wednesday, July 22, 2020 - link
One could ask what the point of Userbenchmark is in these days of quadcores being basically entry level while the benchmark has DECREASED its multicore weighting.A5 - Monday, July 20, 2020 - link
For my own personal test, getting an i7-4770K in the list would be a big help.Once you have a compile test, a Xeon E5-1680v3 would be nice to see so that I can sell my corp on newer workstations...
Shmee - Wednesday, July 22, 2020 - link
Those are great Haswell EP CPUs, and they OC too! I have an E5-1660v3 in my X99 rig.Mockingtruth - Monday, July 20, 2020 - link
I have a 3570k and a E8600 spare with respective motherboards and ram if useful?CampGareth - Monday, July 20, 2020 - link
Personally I'd like to see a Xeon E5-2670 v1 benchmarked. I'm still running a pair of them as my workstation but these days AMD can beat the performance on a single socket and halve the power consumption.Samus - Tuesday, July 21, 2020 - link
Do you run them in an HP Z620? I ran the same system with the same CPU’s for years at one of my clients. What a beast.