Launching the #CPUOverload Project: Testing Every x86 Desktop Processor since 2010
by Dr. Ian Cutress on July 20, 2020 1:30 PM ESTCPU Tests: SPEC2006 1T, SPEC2017 1T, SPEC2017 nT
SPEC2017 and SPEC2006 is a series of standardized tests used to probe the overall performance between different systems, different architectures, different microarchitectures, and setups. The code has to be compiled, and then the results can be submitted to an online database for comparison. It covers a range of integer and floating point workloads, and can be very optimized for each CPU, so it is important to check how the benchmarks are being compiled and run.
We run the tests in a harness built through Windows Subsystem for Linux, developed by our own Andrei Frumusanu. WSL has some odd quirks, with one test not running due to a WSL fixed stack size, but for like-for-like testing is good enough. SPEC2006 is deprecated in favor of 2017, but remains an interesting comparison point in our data. Because our scores aren’t official submissions, as per SPEC guidelines we have to declare them as internal estimates from our part.
For compilers, we use LLVM both for C/C++ and Fortan tests, and for Fortran we’re using the Flang compiler. The rationale of using LLVM over GCC is better cross-platform comparisons to platforms that have only have LLVM support and future articles where we’ll investigate this aspect more. We’re not considering closed-sourced compilers such as MSVC or ICC.
clang version 10.0.0
clang version 7.0.1 (ssh://git@github.com/flang-compiler/flang-driver.git
24bd54da5c41af04838bbe7b68f830840d47fc03)-Ofast -fomit-frame-pointer
-march=x86-64
-mtune=core-avx2
-mfma -mavx -mavx2
Our compiler flags are straightforward, with basic –Ofast and relevant ISA switches to allow for AVX2 instructions. We decided to build our SPEC binaries on AVX2, which puts a limit on Haswell as how old we can go before the testing will fall over. This also means we don’t have AVX512 binaries, primarily because in order to get the best performance, the AVX-512 intrinsic should be packed by a proper expert, as with our AVX-512 benchmark.
To note, the requirements for the SPEC licence state that any benchmark results from SPEC have to be labelled ‘estimated’ until they are verified on the SPEC website as a meaningful representation of the expected performance. This is most often done by the big companies and OEMs to showcase performance to customers, however is quite over the top for what we do as reviewers.
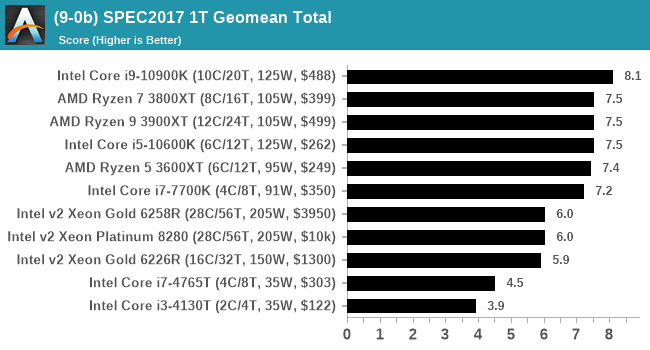
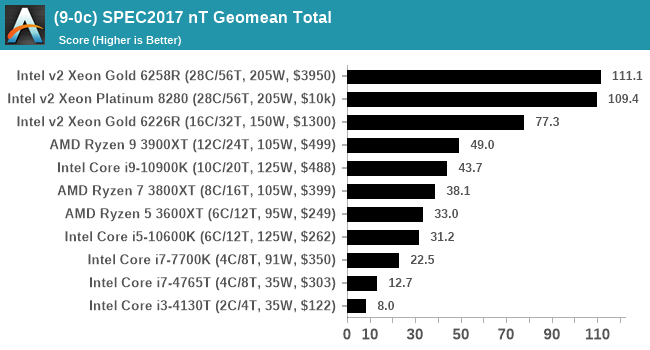
For each of the SPEC targets we are doing, SPEC2006 rate-1, SPEC2017 speed-1, and SPEC2017 speed-N, rather than publish all the separate test data in our reviews, we are going to condense it down into individual data points. The main three will be the geometric means from each of the three suites.

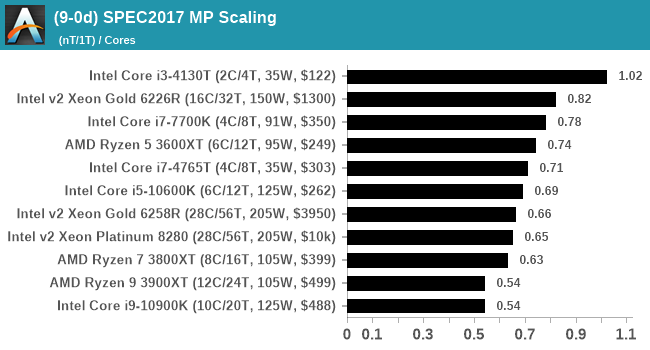
A fourth metric will be a scaling metric, indicating how well the nT result scales to the 1T result for 2017, divided by the number of cores on the chip.
The per-test data will be a part of Bench.
Experienced users should be aware that 521.wrf_r, part of the SPEC2017 suite, does not work in WSL due to the fixed stack size. It is expected to work with WSL2, however we will cross that bridge when we get to it. For now, we’re not giving wrf_r a score, which because we are taking the geometric mean rather than the average, should not affect the results too much.


110 Comments
View All Comments
jebo - Wednesday, July 22, 2020 - link
Can we get a rundown of the underlying systems being used? RAM etc.Thanks for this!
GeoffreyA - Wednesday, July 22, 2020 - link
Astounding work, Ian! All the best on the project.Kdam - Wednesday, July 22, 2020 - link
Thanks for the effort. I was wondering if it was possible to include a cam benchmark (mastercam or other)nathanddrews - Thursday, July 23, 2020 - link
Would it be possible to add a sort or filter to see 95th percentile frame rates only? A filter by quality level? It would make reading the data much easier. QOLOldTech920 - Thursday, July 23, 2020 - link
Your CPU table (on page 2) is weirdly incomplete for Nehalem and Westmere CPUs. Specifically, it's missing the whole 1st generation Nehalem HEDT parts (aka "Bloomfield" 45 nm chips using the X58 chipset), such as i7-920, i7-940, through i7-975 EE . Combined with a recent GPU, these are still amazingly viable 4-core/8-thread CPUs.Robberbaron12 - Monday, July 27, 2020 - link
THere is no support for X58 and skt 1366 anymore in the latest version of Win 10, so its not possible to install the test suite. I know it still works if you had a 3-4 year old version on Win 10 but you can to clean install now, and I'm pretty sure skt 1156 is going the same way.Oxford Guy - Tuesday, July 28, 2020 - link
Windows 10 is a disgrace.juraj2 - Friday, July 24, 2020 - link
That is a great project. I would like to see as performance per watt has been changing during the years. Also, current benchmarks show for example CPU with 105W, but that is completely false because during the test CPU was consuming much more power. This makes results confusing and mostly in favour of Intel. Intel is cheating a lot in this regard.Oxford Guy - Tuesday, July 28, 2020 - link
Real power consumption is definitely more interesting than the "let's pretend" TDP numbers.alpha754293 - Monday, July 27, 2020 - link
This is fantastic!!!I was the person who asked for the OpenSSL benchmark because I was moving a lot of data around and needed SHA256 to ensure the data transfers completed successfully.
Thank you for putting this together.