The Battle of Bay Trail-D: GIGABYTE J1900N-D3V and ASUS J1900I-C Reviewed
by Ian Cutress on October 17, 2014 10:00 AM ESTIntegrated Graphics Gaming on J1900
For our gaming analysis, we took the gaming results from the GIGABYTE J1900N-D3V to compare against other integrated graphics solutions.
F1 2013
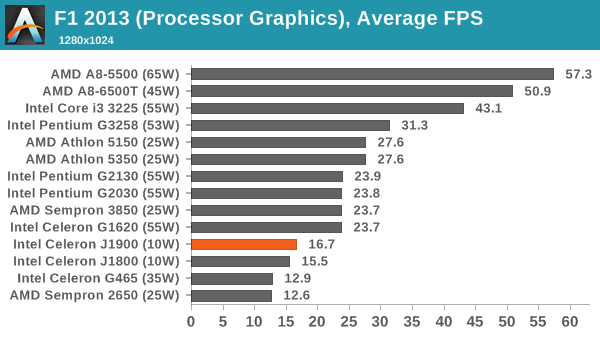
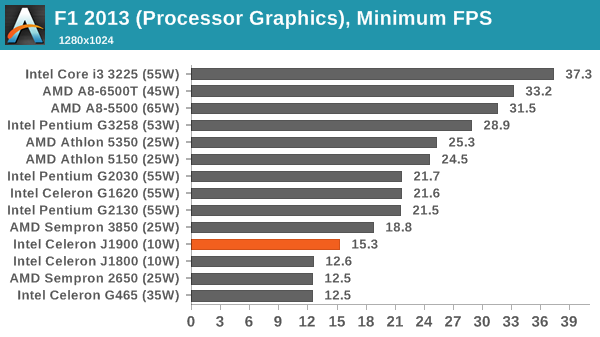
First up is F1 2013 by Codemasters. I am a big Formula 1 fan in my spare time, and nothing makes me happier than carving up the field in a Caterham, waving to the Red Bulls as I drive by (because I play on easy and take shortcuts). F1 2013 uses the EGO Engine, and like other Codemasters games ends up being very playable on old hardware quite easily. In order to beef up the benchmark a bit, we devised the following scenario for the benchmark mode: one lap of Spa-Francorchamps in the heavy wet, the benchmark follows Jenson Button in the McLaren who starts on the grid in 22nd place, with the field made up of 11 Williams cars, 5 Marussia and 5 Caterham in that order. This puts emphasis on the CPU to handle the AI in the wet, and allows for a good amount of overtaking during the automated benchmark. We test at 1280x1024 on Low graphical settings.
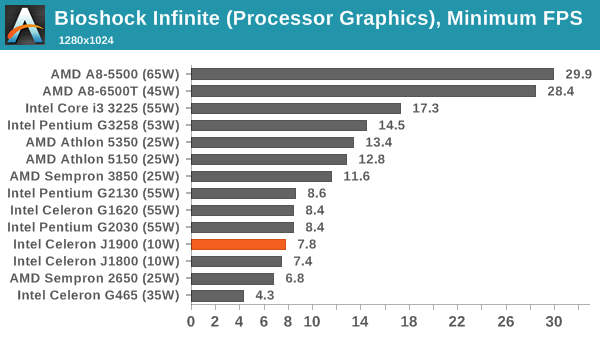
Bioshock Infinite
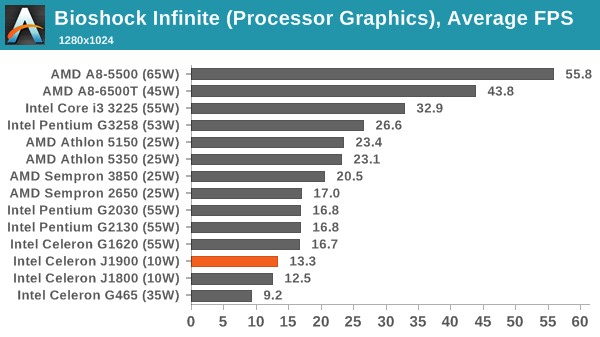
Bioshock Infinite was Zero Punctuation’s Game of the Year for 2013, uses the Unreal Engine 3, and is designed to scale with both cores and graphical prowess. We test the benchmark using the Adrenaline benchmark tool and the Performance (1280x1024, Low) setting, noting down the average frame rates and the minimum frame rates.

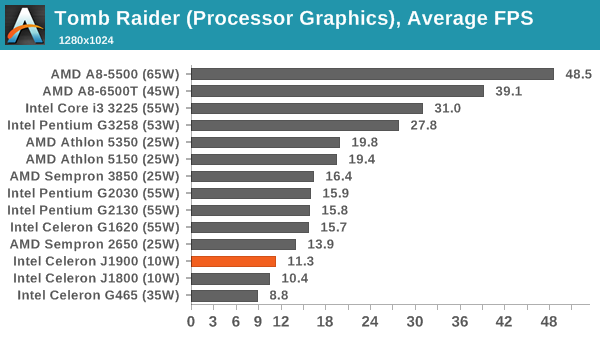
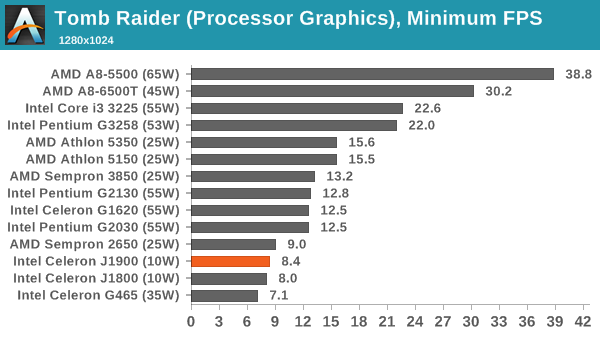
Tomb Raider
The next benchmark in our test is Tomb Raider. Tomb Raider is an AMD optimized game, lauded for its use of TressFX creating dynamic hair to increase the immersion in game. Tomb Raider uses a modified version of the Crystal Engine, and enjoys raw horsepower. We test the benchmark using the Adrenaline benchmark tool and the Performance (1280x1024, Low) setting, noting down the average frame rates and the minimum frame rates.

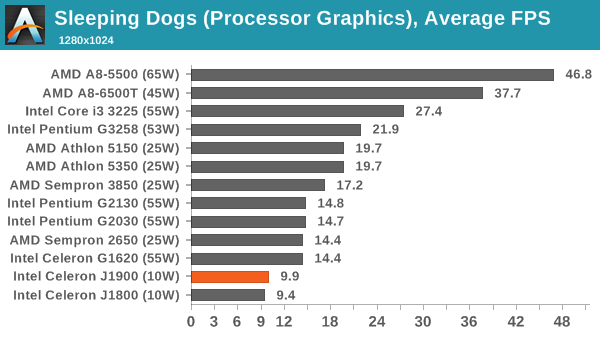
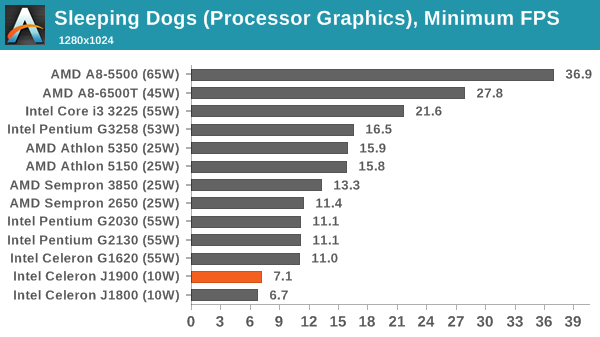
Sleeping Dogs
Sleeping Dogs is a benchmarking wet dream – a highly complex benchmark that can bring the toughest setup and high resolutions down into single figures. Having an extreme SSAO setting can do that, but at the right settings Sleeping Dogs is highly playable and enjoyable. We run the basic benchmark program laid out in the Adrenaline benchmark tool, and the Performance (1280x1024, Low) setting, noting down the average frame rates and the minimum frame rates.

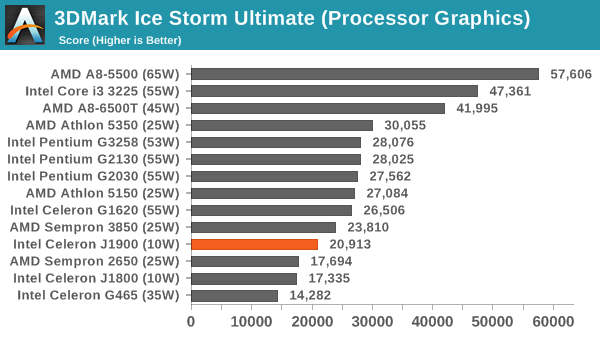
3DMark Ice Storm Ultimate


60 Comments
View All Comments
HiTechObsessed - Friday, October 17, 2014 - link
Should be a big hit with console users. That lower frame-rate for gaming should be super-cinematic then!XZerg - Friday, October 17, 2014 - link
The power consumption delta is something I do not like. I rather see the idle and load instead. The idle tells me how much my "nas/htpc" system will consume while doing nothing. the load tells me what is the absolute worse it will consume. this allows me to weigh the options better on power consumption basis, not the delta as that's not what is going to matter when the system is going to be idling for prolonged periods.looncraz - Friday, October 17, 2014 - link
+1In this light, one extra watt for the faster performing (barely, but true, and much more so in gaming) 25W AMD option looks to be the real winner. Cheaper, only an extra watt of power used (in the delta measure anyway), etc... But, in the real world, the AMD may idle at 16W and the intel will idle at 8W... which may matter if planning on running multiple systems and using UPS protection such as in an office/school/government environment.
jospoortvliet - Friday, October 17, 2014 - link
Good news is that most reviews I've seen put the AMD at a lower idle power than the Intel. The total load is closer than the difference graph makes it look, no idea why those are used...maco - Friday, October 17, 2014 - link
Agreed, I'd like to see idle and load graphs too. I tend to leave a computer on doing light server tasks, so idle power is an important metric for me.danzig - Saturday, October 18, 2014 - link
Same here concerning the power graphs. If there is a revision or edit of the page, could you please put more power consumption info up, if you have the data?KWIE - Monday, October 20, 2014 - link
I use mine as a NAS also, with FreeNAS/Plex. I haven't clocked it yet higher than 19W.Guspaz - Monday, October 20, 2014 - link
Agreed the delta numbers are useless. A system with an idle/load power consumption of 10W/20W would show up the same in the chart as a system with an idle/load power consumption of 500/510W, as admittedly contrived as that scenario is. But something like 10/20 versus 20/30 isn't so crazy.Guspaz - Monday, October 20, 2014 - link
Also, the graph says "lower is better", but that's not true at all. Given two processors with equal load power draw, the processor with the lower idle power draw "wins" that benchmark, but that means you want the processor with the *BIGGER* delta, not the smaller delta!AJSB - Friday, October 17, 2014 - link
AMD AM1 APUs based on Kabini simply CRUSH these abortions as for light gaming goes (and BTW, 1280x1024 is near 30% more pixels than of a 1366x768 monitor)....wait for AMD Beema AM1 ;)