The Battle of Bay Trail-D: GIGABYTE J1900N-D3V and ASUS J1900I-C Reviewed
by Ian Cutress on October 17, 2014 10:00 AM ESTCPU Benchmarks
Readers of our motherboard review section will have noted the trend in modern motherboards to implement a form of MultiCore Enhancement / Acceleration / Turbo (read our report here) on their motherboards. This does several things, including better benchmark results at stock settings (not entirely needed if overclocking is an end-user goal) at the expense of heat and temperature. It also gives in essence an automatic overclock which may be against what the user wants. Our testing methodology is ‘out-of-the-box’, with the latest public BIOS installed and XMP enabled, and thus subject to the whims of this feature. It is ultimately up to the motherboard manufacturer to take this risk – and manufacturers taking risks in the setup is something they do on every product (think C-state settings, USB priority, DPC Latency / monitoring priority, memory subtimings at JEDEC). Processor speed change is part of that risk, and ultimately if no overclocking is planned, some motherboards will affect how fast that shiny new processor goes and can be an important factor in the system build.
Neither the GIGABYTE J1900N-D3V nor ASUS J1900I-C had any form of MultiCore Turbo.
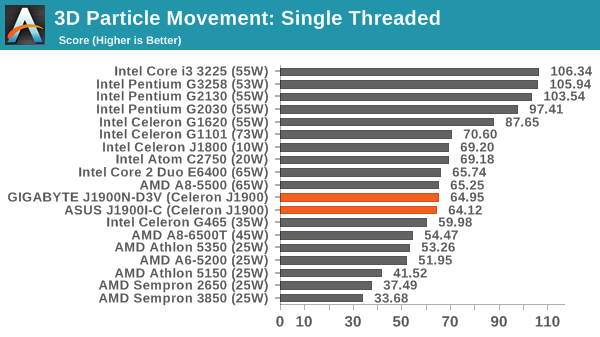
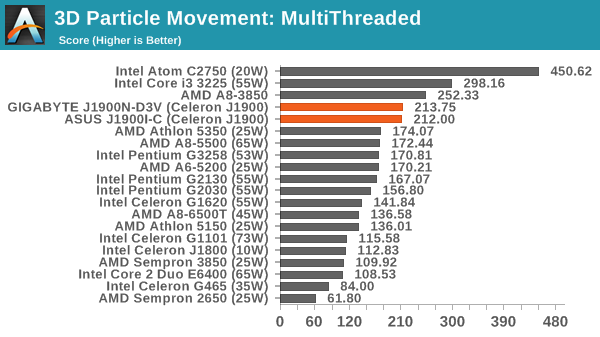
Point Calculations – 3D Movement Algorithm Test: link
3DPM is a self-penned benchmark, taking basic 3D movement algorithms used in Brownian Motion simulations and testing them for speed. High floating point performance, MHz and IPC wins in the single thread version, whereas the multithread version has to handle the threads and loves more cores.
Compression – WinRAR 5.0.1: link
Our WinRAR test from 2013 is updated to the latest version of WinRAR at the start of 2014. We compress a set of 2867 files across 320 folders totaling 1.52 GB in size – 95% of these files are small typical website files, and the rest (90% of the size) are small 30 second 720p videos.
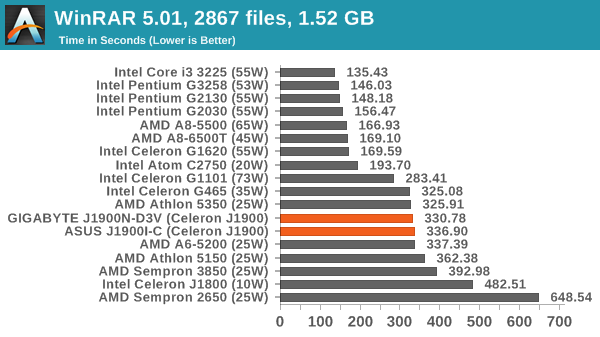
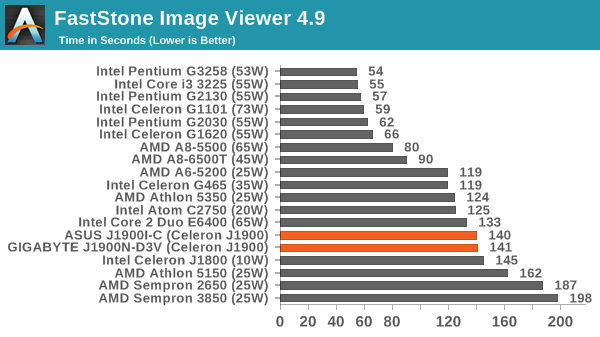
Image Manipulation – FastStone Image Viewer 4.9: link
Similarly to WinRAR, the FastStone test us updated for 2014 to the latest version. FastStone is the program I use to perform quick or bulk actions on images, such as resizing, adjusting for color and cropping. In our test we take a series of 170 images in various sizes and formats and convert them all into 640x480 .gif files, maintaining the aspect ratio. FastStone does not use multithreading for this test, and thus single threaded performance is often the winner.
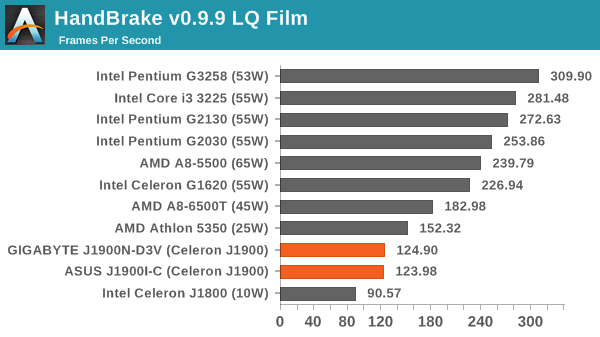
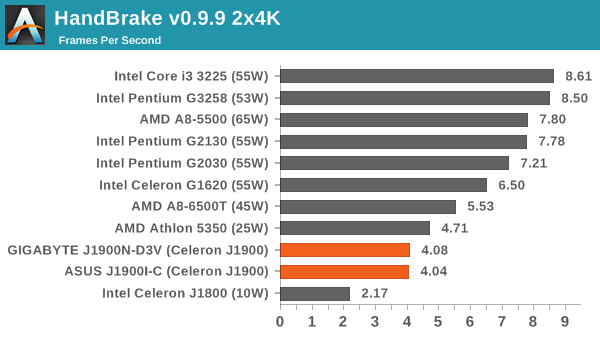
Video Conversion – Handbrake v0.9.9: link
Handbrake is a media conversion tool that was initially designed to help DVD ISOs and Video CDs into more common video formats. The principle today is still the same, primarily as an output for H.264 + AAC/MP3 audio within an MKV container. In our test we use the same videos as in the Xilisoft test, and results are given in frames per second.
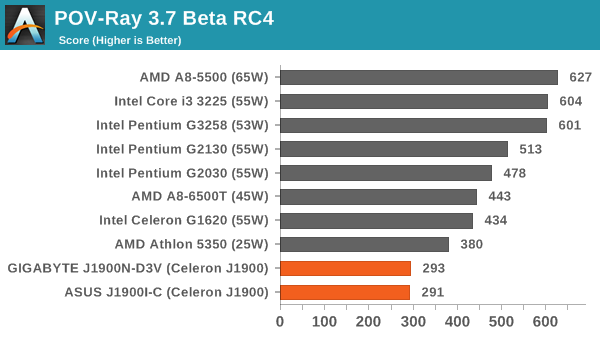
Rendering – PovRay 3.7: link
The Persistence of Vision RayTracer, or PovRay, is a freeware package for as the name suggests, ray tracing. It is a pure renderer, rather than modeling software, but the latest beta version contains a handy benchmark for stressing all processing threads on a platform. We have been using this test in motherboard reviews to test memory stability at various CPU speeds to good effect – if it passes the test, the IMC in the CPU is stable for a given CPU speed. As a CPU test, it runs for approximately 2-3 minutes on high end platforms.
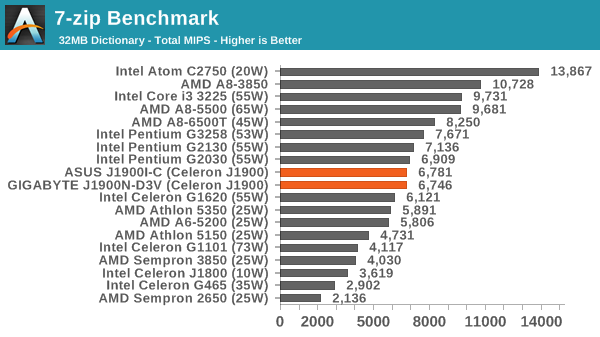
Synthetic – 7-Zip 9.2: link
As an open source compression tool, 7-Zip is a popular tool for making sets of files easier to handle and transfer. The software offers up its own benchmark, to which we report the result.
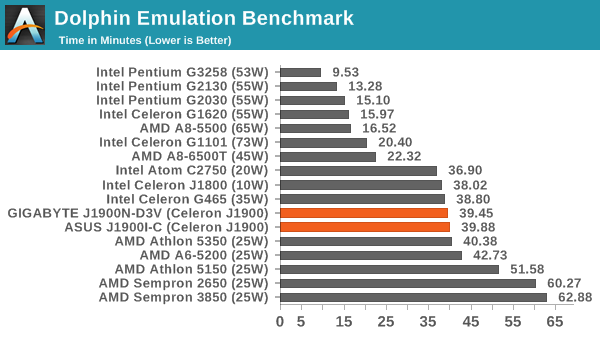
Emulation - Dolphin Benchmark: link
Many emulators are often bound by single thread CPU performance, and general reports tended to suggest that Haswell provided a significant boost to emulator performance. This benchmark runs a Wii program that raytraces a complex 3D scene inside the Dolphin Wii emulator. Performance on this benchmark is a good proxy of the speed of Dolphin CPU emulation, which is an intensive single core task using most aspects of a CPU. Results are given in minutes, where the Wii itself scores 17.53 minutes.
Web Benchmarks on the Celeron J1900
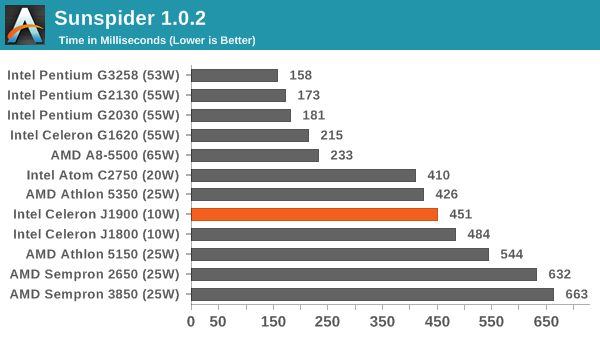
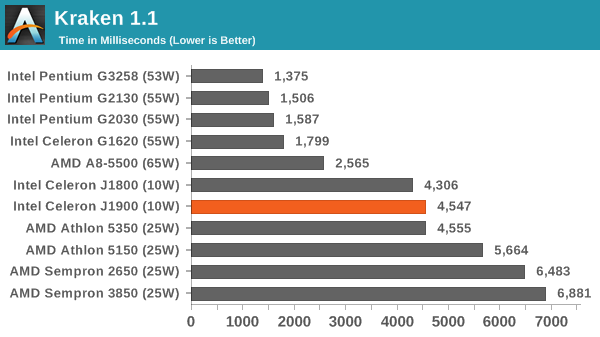
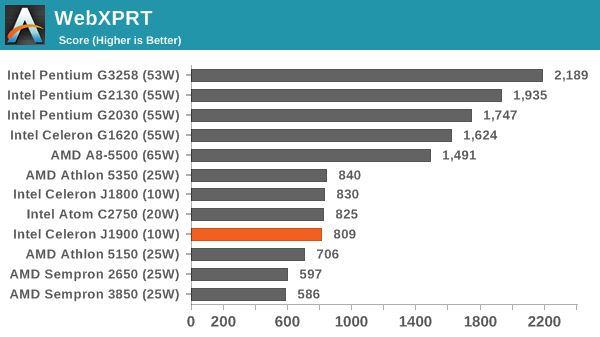
On the lower end processors, general usability is a big factor of experience, especially as we move into the HTML5 era of web browsing. For our web benchmarks, we take four well known tests with Chrome 35 as a consistent browser.
Sunspider 1.0.2
Mozilla Kraken 1.1
WebXPRT
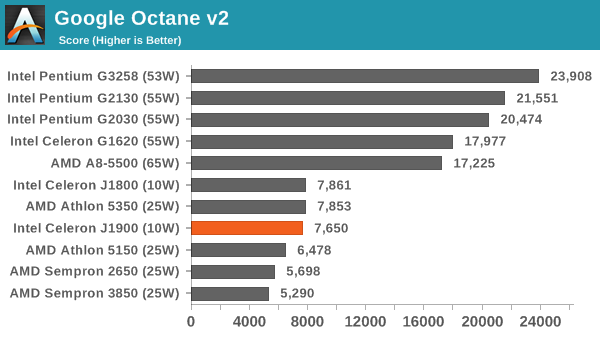
Google Octane v2


60 Comments
View All Comments
HiTechObsessed - Friday, October 17, 2014 - link
Should be a big hit with console users. That lower frame-rate for gaming should be super-cinematic then!XZerg - Friday, October 17, 2014 - link
The power consumption delta is something I do not like. I rather see the idle and load instead. The idle tells me how much my "nas/htpc" system will consume while doing nothing. the load tells me what is the absolute worse it will consume. this allows me to weigh the options better on power consumption basis, not the delta as that's not what is going to matter when the system is going to be idling for prolonged periods.looncraz - Friday, October 17, 2014 - link
+1In this light, one extra watt for the faster performing (barely, but true, and much more so in gaming) 25W AMD option looks to be the real winner. Cheaper, only an extra watt of power used (in the delta measure anyway), etc... But, in the real world, the AMD may idle at 16W and the intel will idle at 8W... which may matter if planning on running multiple systems and using UPS protection such as in an office/school/government environment.
jospoortvliet - Friday, October 17, 2014 - link
Good news is that most reviews I've seen put the AMD at a lower idle power than the Intel. The total load is closer than the difference graph makes it look, no idea why those are used...maco - Friday, October 17, 2014 - link
Agreed, I'd like to see idle and load graphs too. I tend to leave a computer on doing light server tasks, so idle power is an important metric for me.danzig - Saturday, October 18, 2014 - link
Same here concerning the power graphs. If there is a revision or edit of the page, could you please put more power consumption info up, if you have the data?KWIE - Monday, October 20, 2014 - link
I use mine as a NAS also, with FreeNAS/Plex. I haven't clocked it yet higher than 19W.Guspaz - Monday, October 20, 2014 - link
Agreed the delta numbers are useless. A system with an idle/load power consumption of 10W/20W would show up the same in the chart as a system with an idle/load power consumption of 500/510W, as admittedly contrived as that scenario is. But something like 10/20 versus 20/30 isn't so crazy.Guspaz - Monday, October 20, 2014 - link
Also, the graph says "lower is better", but that's not true at all. Given two processors with equal load power draw, the processor with the lower idle power draw "wins" that benchmark, but that means you want the processor with the *BIGGER* delta, not the smaller delta!AJSB - Friday, October 17, 2014 - link
AMD AM1 APUs based on Kabini simply CRUSH these abortions as for light gaming goes (and BTW, 1280x1024 is near 30% more pixels than of a 1366x768 monitor)....wait for AMD Beema AM1 ;)