Crucial X10 Pro Portable SSD Review: 20 Gbps Performance in a Budget Offering
by Ganesh T S on November 10, 2023 8:00 AM ESTPerformance Benchmarks
Benchmarks such as ATTO and CrystalDiskMark help provide a quick look at the performance of the direct-attached storage device. The results translate to the instantaneous performance numbers that consumers can expect for specific workloads, but do not account for changes in behavior when the unit is subject to long-term conditioning and/or thermal throttling. Yet another use of these synthetic benchmarks is the ability to gather information regarding support for specific storage device features that affect performance.
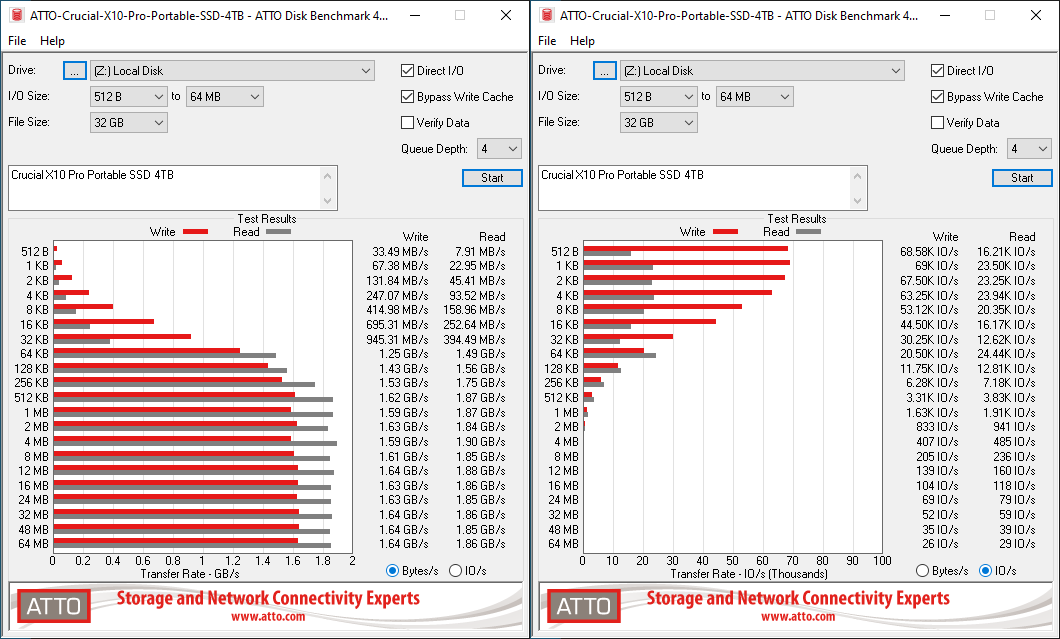
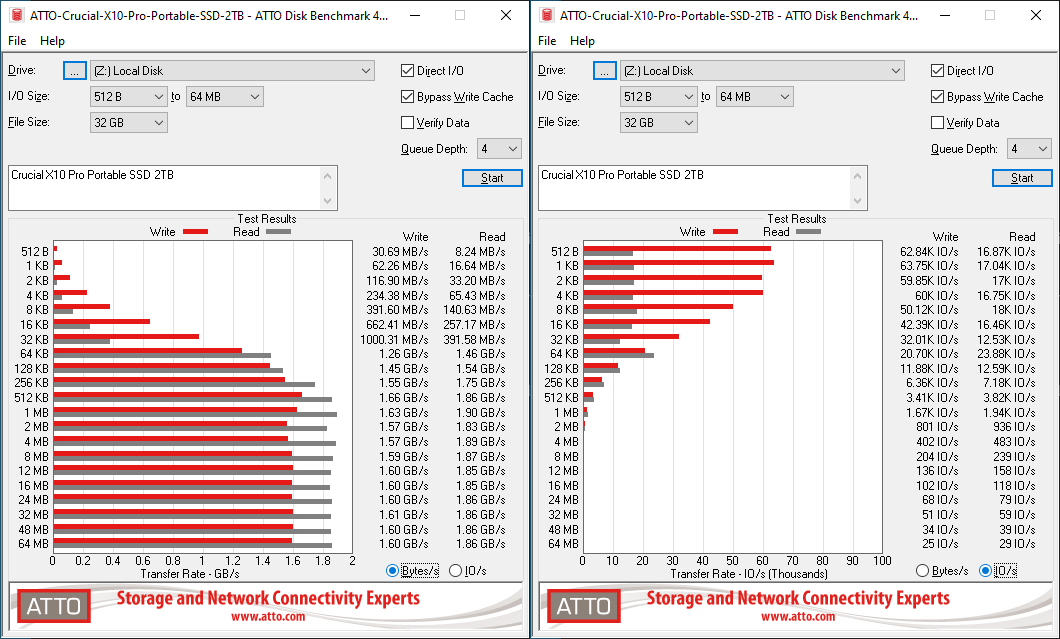
Crucial claims read and write speeds of 2100 MBps and 2000 MBps respectively for all three SKUs. We do get numbers close to those in the ATTO benchmarks presented below. Our ATTO benchmarking is restricted to a single configuration in terms of queue depth, and is only representative of a small sub-set of real-world workloads. As such, the used configuration can't back up Crucial's claims completely. However, the results do allow the visualization of change in transfer rates as the I/O size changes, with optimal performance being reached around 512 KB for a queue depth of 4 across all the capacity points.
| ATTO Benchmarks | |
| TOP: | BOTTOM: |
 |
|
 |
|
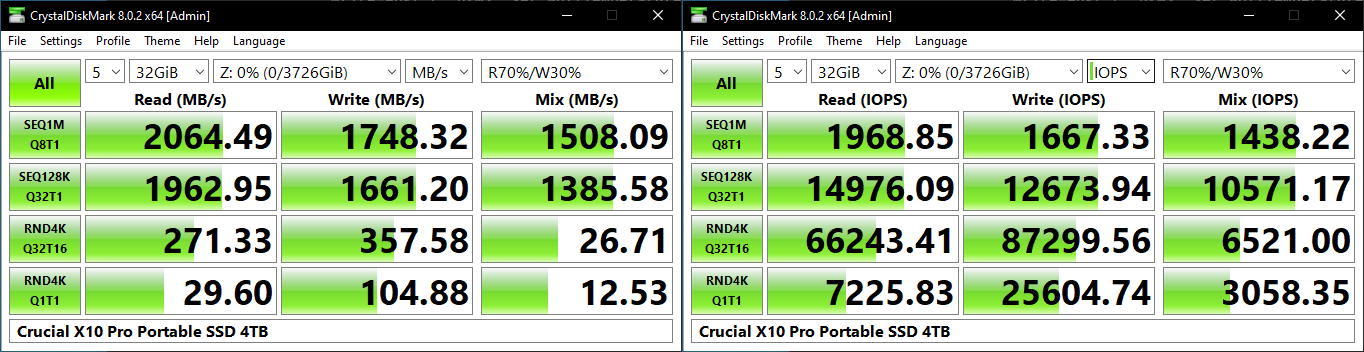
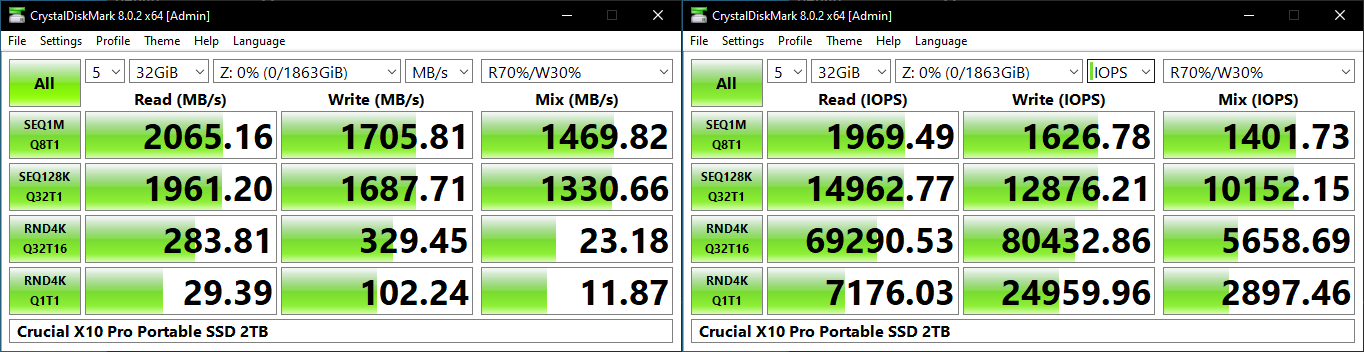
CrystalDiskMark uses four different access traces for reads and writes over a configurable region size. Two of the traces are sequential accesses, while two are 4K random accesses. Internally, CrystalDiskMark uses the Microsoft DiskSpd storage testing tool. The 'Seq128K Q32T1' sequential traces use 128K block size with a queue depth of 32 from a single thread, while the '4K Q32T16' one does random 4K accesses with the same queue configuration, but from multiple threads. The 'Seq1M' traces use a 1MiB block size. The plain 'Rnd4K' one uses only a single queue and single thread . Comparing the '4K Q32T16' and '4K Q1T1' numbers can quickly tell us whether the storage device supports NCQ (native command queuing) / UASP (USB-attached SCSI protocol). If the numbers for the two access traces are in the same ballpark, NCQ / UASP is not supported. This assumes that the host port / drivers on the PC support UASP.
| CrystalDiskMark Benchmarks | |
| TOP: | BOTTOM: |
 |
|
 |
|
Sequential reads match Crucial's claims at a queue depth of 8 for all three models. Sequential writes top out around 1750 MBps for the 4TB SKU, but drops down to around 1600 MBps for the 1TB version. On the random access front, we see a marked increase in IOPS when moving from a queue depth of 1 to 32, indicating that NCQ is active and working well.
Competitive analysis will be dealt with in subsequent sections, but it makes sense to point out that the sequential read numbers are not markedly different for the considered PSSDs. Writes are a different story, with the native UFD controller-based units bunched at the mid-range (between 1500 - 1750 MBps). The bridge-based PSSDs with DRAM-equipped internal units are able to hit the 2 GBps number. Ones using a DRAM-less platform with the bridge (such as the Samsung T9) hit around 1.9 GBps. The high queue-depth random reads are better in the T9, but that platform / firmware doesn't seem to be optimized for writes with similar characteristics, and comes in with less than a third of the IOPS of the equivalent Crucial X10 Pro.
AnandTech DAS Suite - Benchmarking for Performance Consistency
Our testing methodology for storage bridges / direct-attached storage units takes into consideration the usual use-case for such devices. The most common usage scenario is transfer of large amounts of photos and videos to and from the unit. Other usage scenarios include the use of the unit as a download or install location for games and importing files directly from it into a multimedia editing program such as Adobe Photoshop. Some users may even opt to boot an OS off an external storage device.
The AnandTech DAS Suite tackles the first use-case. The evaluation involves processing five different workloads:
- AV: Multimedia content with audio and video files totalling 24.03 GB over 1263 files in 109 sub-folders
- Home: Photos and document files totalling 18.86 GB over 7627 files in 382 sub-folders
- BR: Blu-ray folder structure totalling 23.09 GB over 111 files in 10 sub-folders
- ISOs: OS installation files (ISOs) totalling 28.61 GB over 4 files in one folder
- Disk-to-Disk: Addition of 223.32 GB spread over 171 files in 29 sub-folders to the above four workloads (total of 317.91 GB over 9176 files in 535 sub-folders)
Except for the 'Disk-to-Disk' workload, each data set is first placed in a 29GB RAM drive, and a robocopy command is issue to transfer it to the external storage unit (formatted in exFAT for flash-based units, and NTFS for HDD-based units).
robocopy /NP /MIR /NFL /J /NDL /MT:32 $SRC_PATH $DEST_PATH
Upon completion of the transfer (write test), the contents from the unit are read back into the RAM drive (read test) after a 10 second idling interval. This process is repeated three times for each workload. Read and write speeds, as well as the time taken to complete each pass are recorded. Whenever possible, the temperature of the external storage device is recorded during the idling intervals. Bandwidth for each data set is computed as the average of all three passes.
The 'Disk-to-Disk' workload involves a similar process, but with one iteration only. The data is copied to the external unit from the CPU-attached NVMe drive, and then copied back to the internal drive. It does include more amount of continuous data transfer in a single direction, as data that doesn't fit in the RAM drive is also part of the workload set.
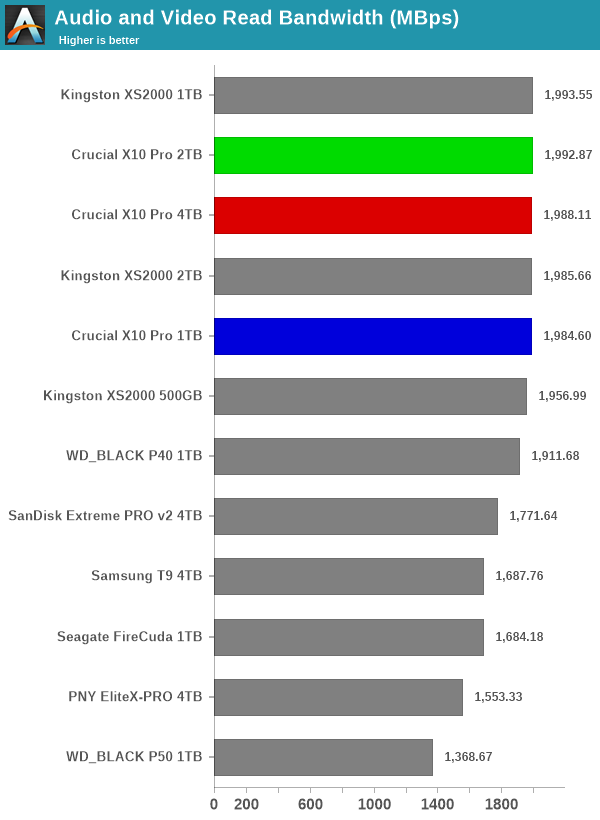
It can be seen that there is no significant gulf in the numbers between the different units in the read workloads. For all practical purposes, the casual user will notice no difference between them in the course of normal usage. However, writes are a completely different story. The three X10 Pro SKUs come in the bottom half of the graphs, and present widely varying numbers. As we find further down in our evaluation of the performance consistency, the SKUs - particularly the 1TB variant - can start to exhibit performance loss after being subject to repeated stress.
Power users may want to dig deeper to understand the limits of each device. To address this concern, we also instrumented our evaluation scheme for determining performance consistency.
Performance Consistency
Aspects influencing the performance consistency include SLC caching and thermal throttling / firmware caps on access rates to avoid overheating. This is important for power users, as the last thing that they want to see when copying over 100s of GB of data is the transfer rate going down to USB 2.0 speeds.
In addition to tracking the instantaneous read and write speeds of the DAS when processing the AnandTech DAS Suite, the temperature of the drive was also recorded. In earlier reviews, we used to track the temperature all through. However, we have observed that SMART read-outs for the temperature in NVMe SSDs using USB 3.2 Gen 2 bridge chips end up negatively affecting the actual transfer rates. To avoid this problem, we have restricted ourselves to recording the temperature only during the idling intervals. The graphs below present the recorded data.
| AnandTech DAS Suite - Performance Consistency | |
| TOP: | BOTTOM: |
 |
|
 |
|
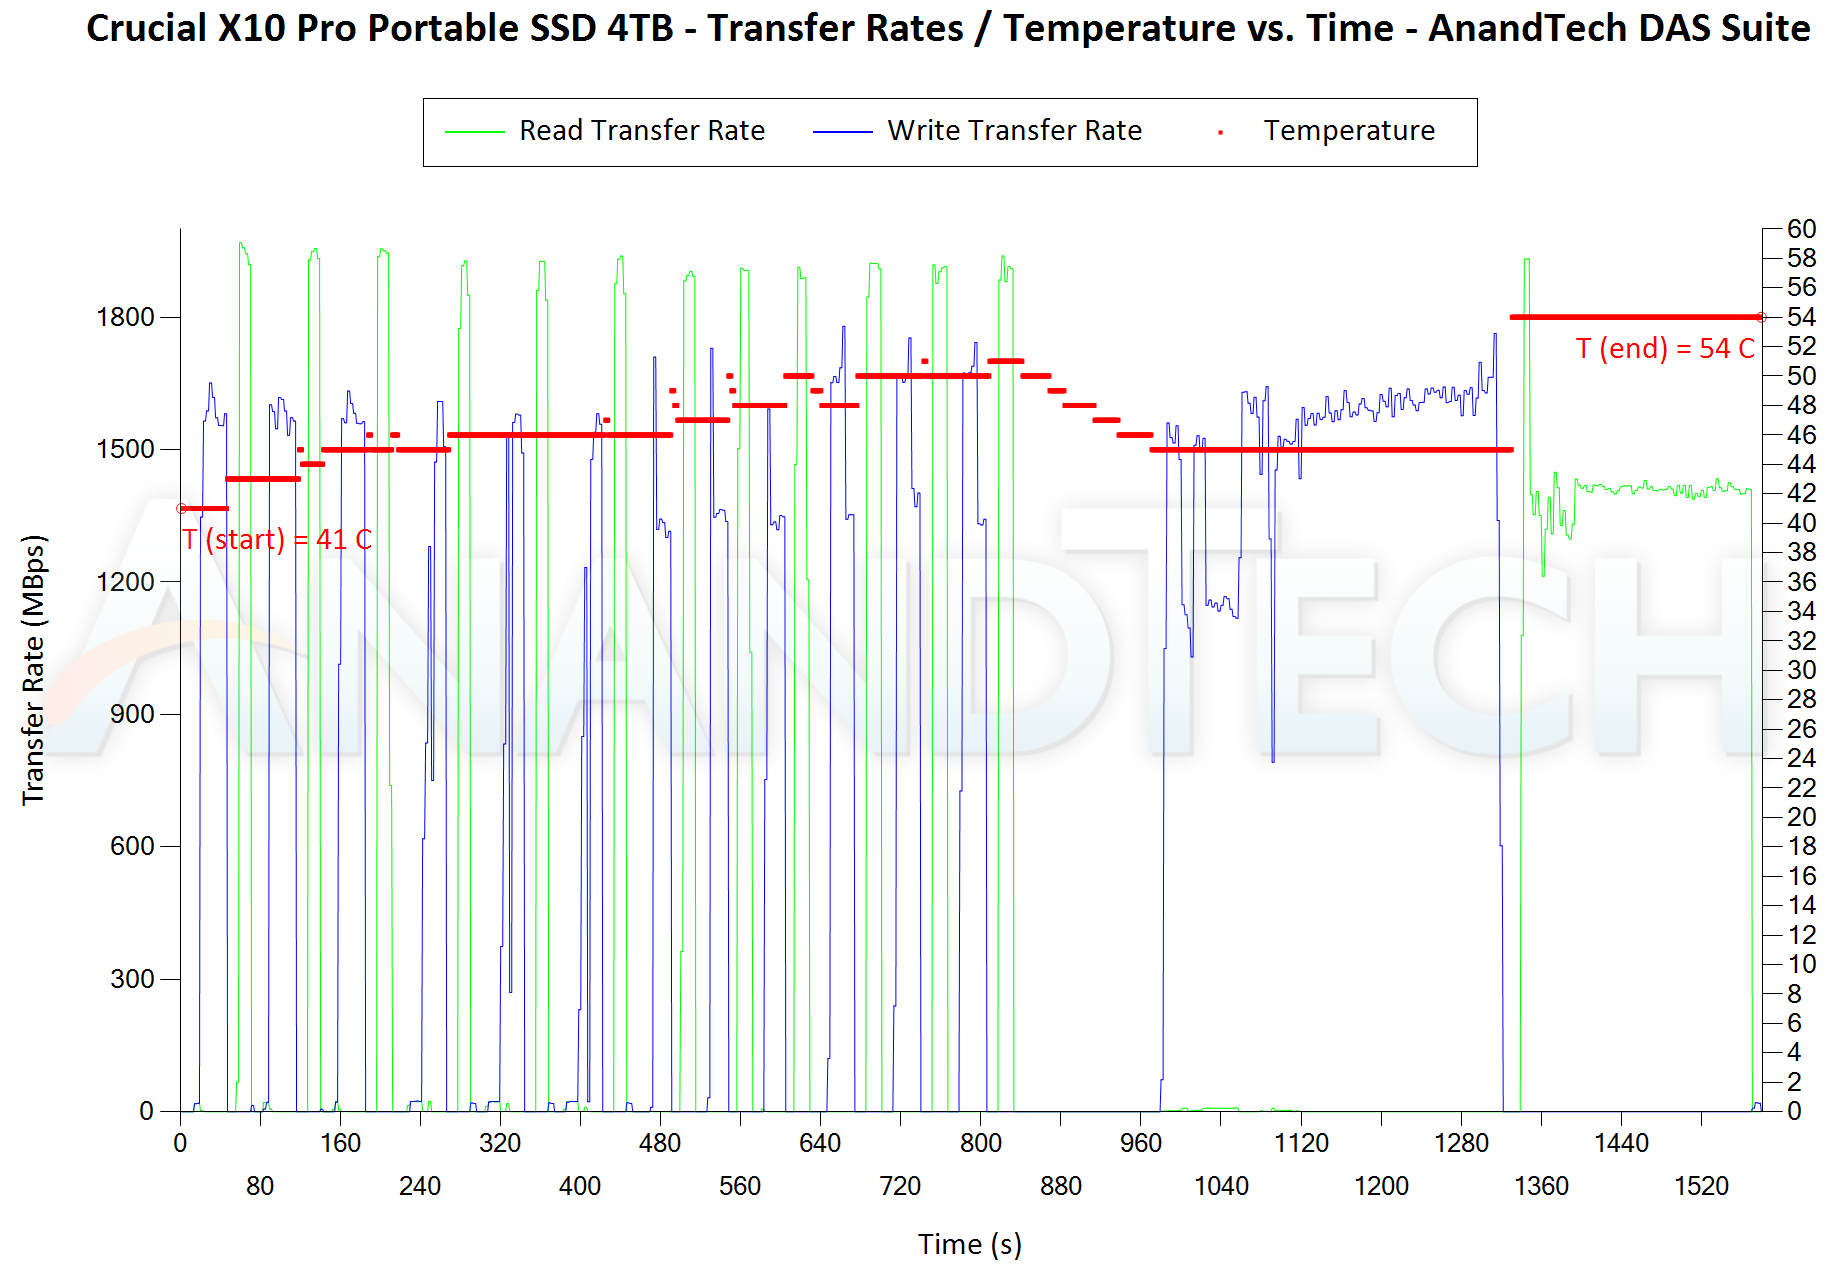
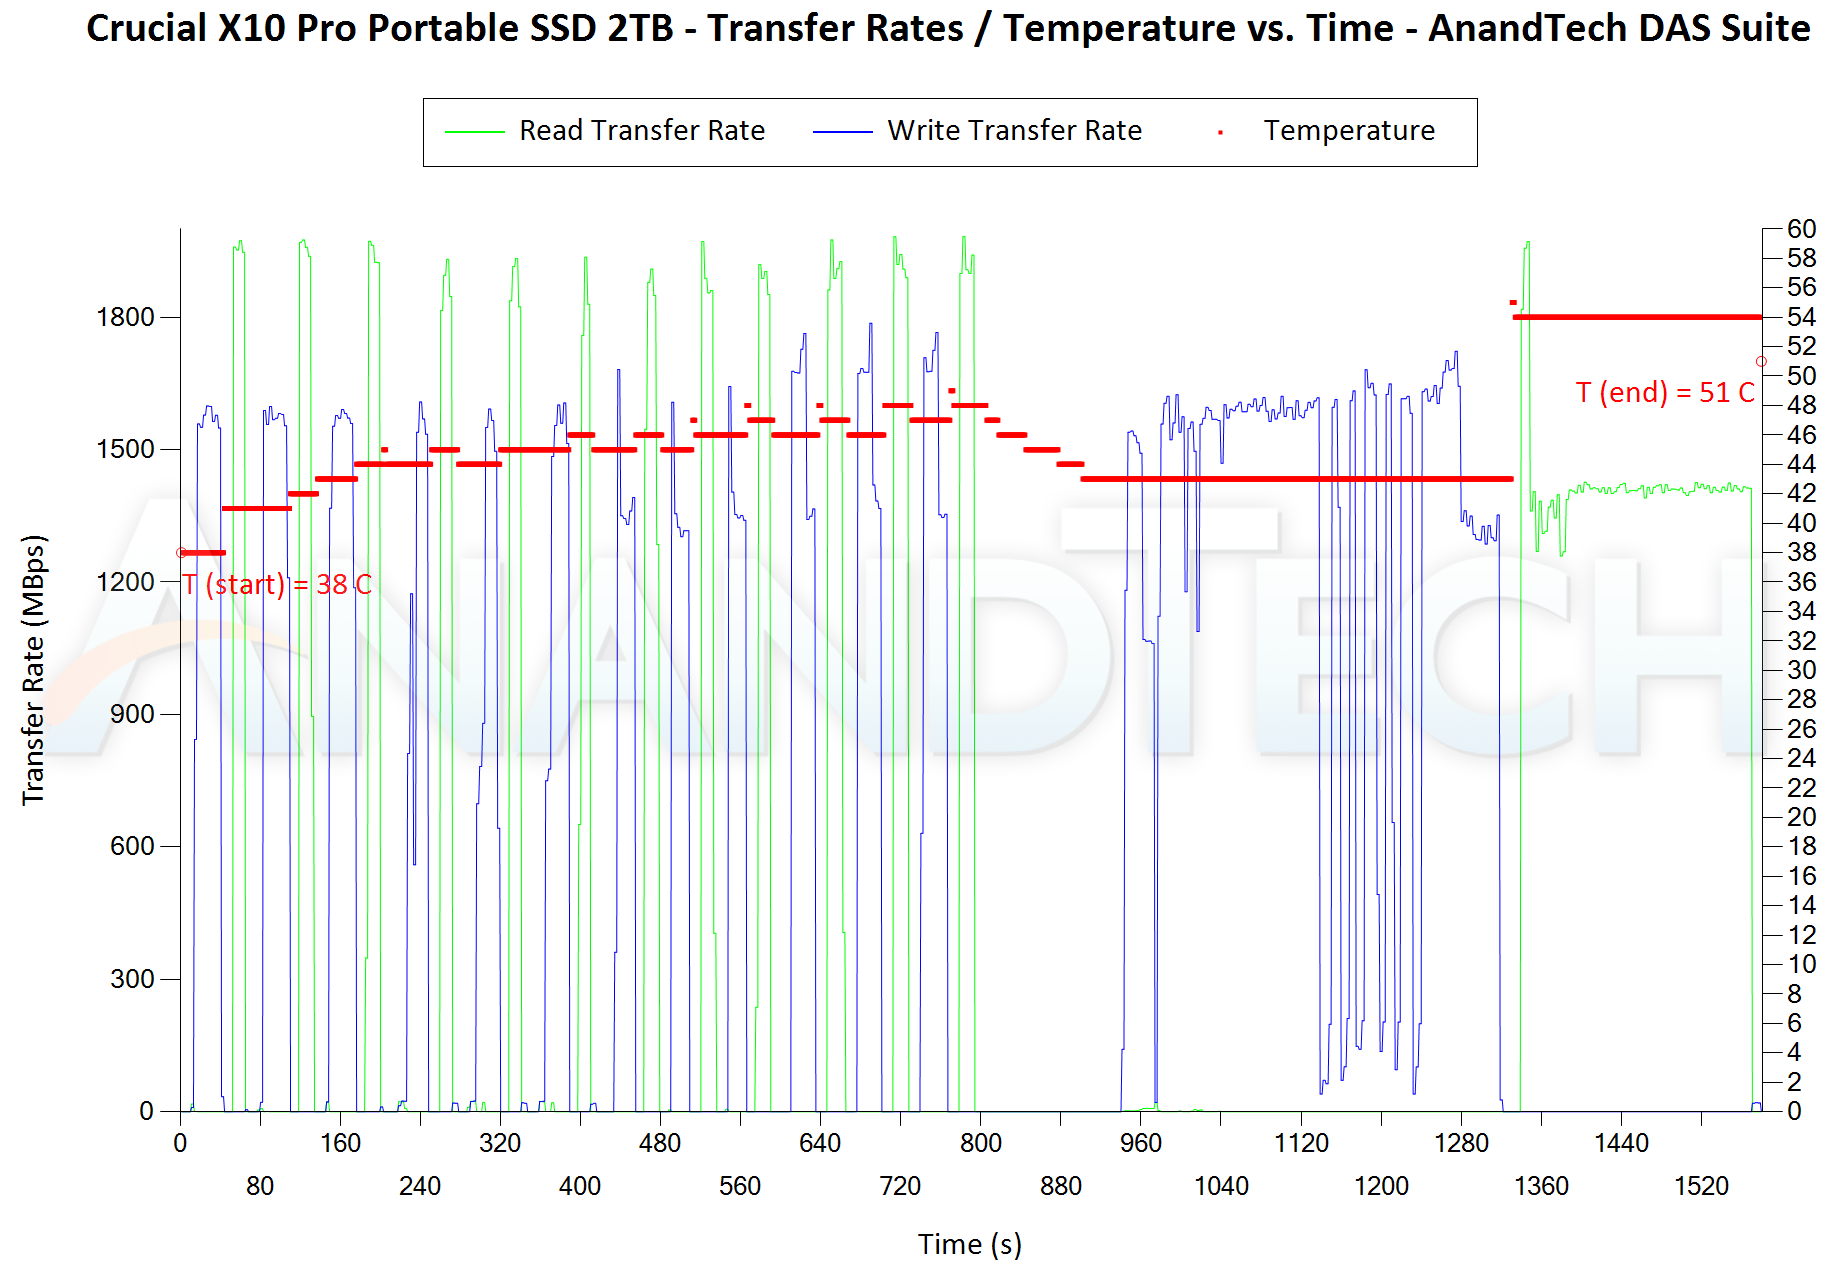
The first three sets of writes and reads correspond to the AV suite. A small gap (for the transfer of the video suite from the internal SSD to the RAM drive) is followed by three sets for the Home suite. Another small RAM-drive transfer gap is followed by three sets for the Blu-ray folder. This is followed up with the large-sized ISO files set. Finally, we have the single disk-to-disk transfer set.
While the initial sets perform creditably in terms of consistency, we see cracks start to appear during the disk-to-disk transfer set. Instantaneous write speeds go as low as 50 MBps and this loss is particularly brutal for the 1TB version. The transfer of around 318 GB takes as much as 20 minutes in the 1TB version, compared to around 5 minutes for the 4TB one and around 6 minutes for the 2TB SKU. Thermal throttling, thankfully, doesn't seem to be the issue, as we see temperatures topping out at just 56C (across all SKUs) during the course of this test.
PCMark 10 Storage Bench - Real-World Access Traces
There are a number of storage benchmarks that can subject a device to artificial access traces by varying the mix of reads and writes, the access block sizes, and the queue depth / number of outstanding data requests. We saw results from two popular ones - ATTO, and CrystalDiskMark - in a previous section. More serious benchmarks, however, actually replicate access traces from real-world workloads to determine the suitability of a particular device for a particular workload. Real-world access traces may be used for simulating the behavior of computing activities that are limited by storage performance. Examples include booting an operating system or loading a particular game from the disk.
PCMark 10's storage bench (introduced in v2.1.2153) includes four storage benchmarks that use relevant real-world traces from popular applications and common tasks to fully test the performance of the latest modern drives:
- The Full System Drive Benchmark uses a wide-ranging set of real-world traces from popular applications and common tasks to fully test the performance of the fastest modern drives. It involves a total of 204 GB of write traffic.
- The Quick System Drive Benchmark is a shorter test with a smaller set of less demanding real-world traces. It subjects the device to 23 GB of writes.
- The Data Drive Benchmark is designed to test drives that are used for storing files rather than applications. These typically include NAS drives, USB sticks, memory cards, and other external storage devices. The device is subjected to 15 GB of writes.
- The Drive Performance Consistency Test is a long-running and extremely demanding test with a heavy, continuous load for expert users. In-depth reporting shows how the performance of the drive varies under different conditions. This writes more than 23 TB of data to the drive.
Despite the data drive benchmark appearing most suitable for testing direct-attached storage, we opt to run the full system drive benchmark as part of our evaluation flow. Many of us use portable flash drives as boot drives and storage for Steam games. These types of use-cases are addressed only in the full system drive benchmark.
The Full System Drive Benchmark comprises of 23 different traces. For the purpose of presenting results, we classify them under five different categories:
- Boot: Replay of storage access trace recorded while booting Windows 10
- Creative: Replay of storage access traces recorded during the start up and usage of Adobe applications such as Acrobat, After Effects, Illustrator, Premiere Pro, Lightroom, and Photoshop.
- Office: Replay of storage access traces recorded during the usage of Microsoft Office applications such as Excel and Powerpoint.
- Gaming: Replay of storage access traces recorded during the start up of games such as Battlefield V, Call of Duty Black Ops 4, and Overwatch.
- File Transfers: Replay of storage access traces (Write-Only, Read-Write, and Read-Only) recorded during the transfer of data such as ISOs and photographs.
PCMark 10 also generates an overall score, bandwidth, and average latency number for quick comparison of different drives. The sub-sections in the rest of the page reference the access traces specified in the PCMark 10 Technical Guide.
Booting Windows 10
The read-write bandwidth recorded for each drive in the boo access trace is presented below.
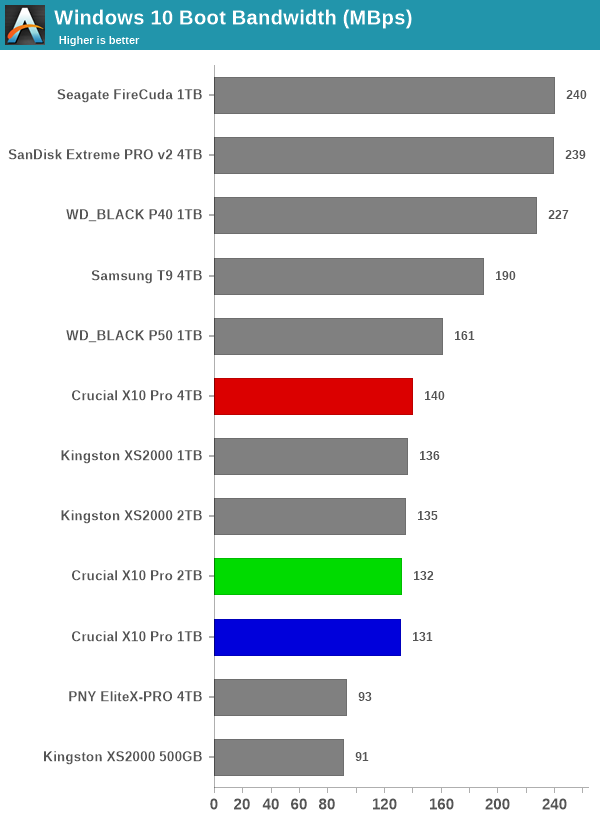
Low queue depth random accesses usually get better performance with DRAM-equipped SSDs using dedicated high-performance NVMe SSD controllers. So, it is not a surprise that the SM2320-equipped Crucial X10 Pro SKUs can only deliver passable performance as a boot drive, making up the bottom half of the pack.
Creative Workloads
The read-write bandwidth recorded for each drive in the sacr, saft, sill, spre, slig, sps, aft, exc, ill, ind, psh, and psl access traces are presented below.
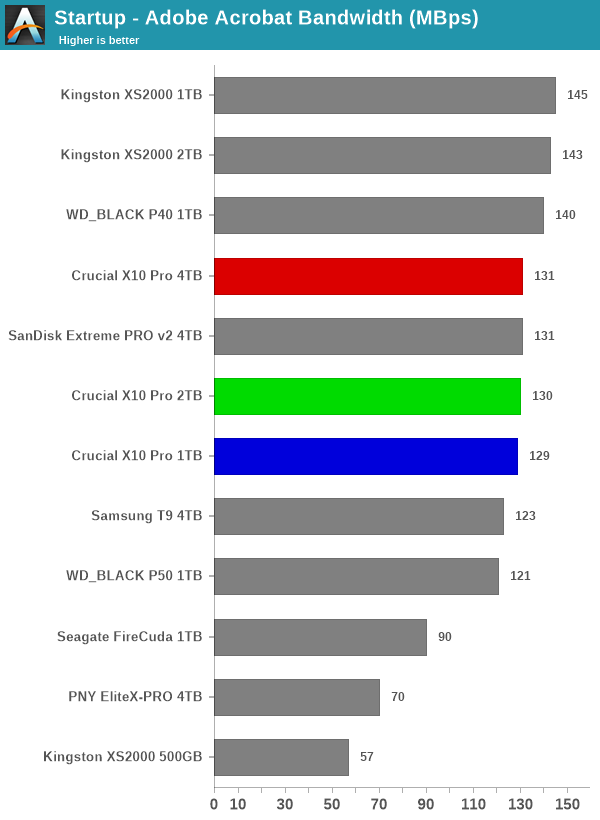
The X10 Pro SKUs fare much better for creative workloads, as many of the traces are sequential in nature. This allows the SKUs to make up the middle of the pack, with the 4TB version edging out the lower capacity points comfortably. Bridge-based solutions still deliver better overall performance for these workloads.
Office Workloads
The read-write bandwidth recorded for each drive in the exc and pow access traces are presented below.
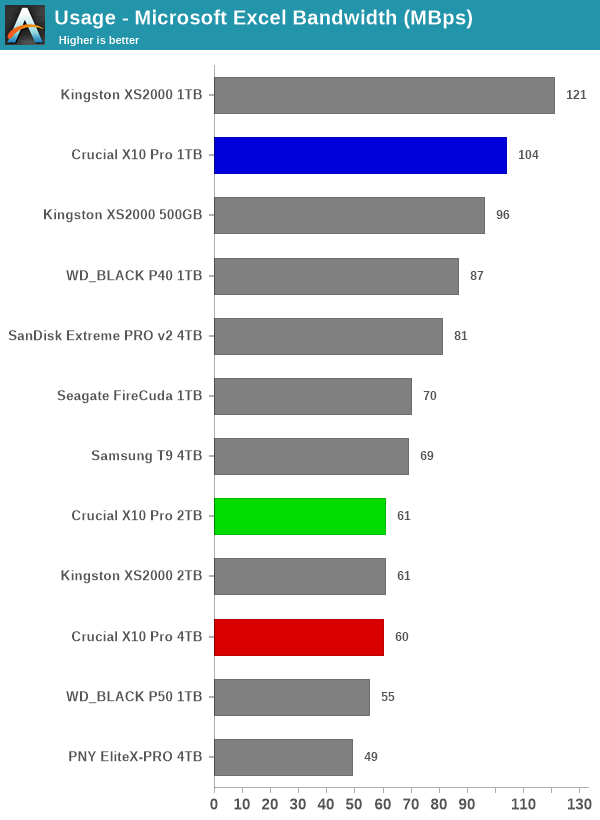
The 4TB version again performs much better for the spreadsheet workload, making it to the top two while edging out even the bridge-based solutions. However, the performance of all three SKUs for the presentation workload lands them in the second half.
Gaming Workloads
The read-write bandwidth recorded for each drive in the bf, cod, and ow access traces are presented below.
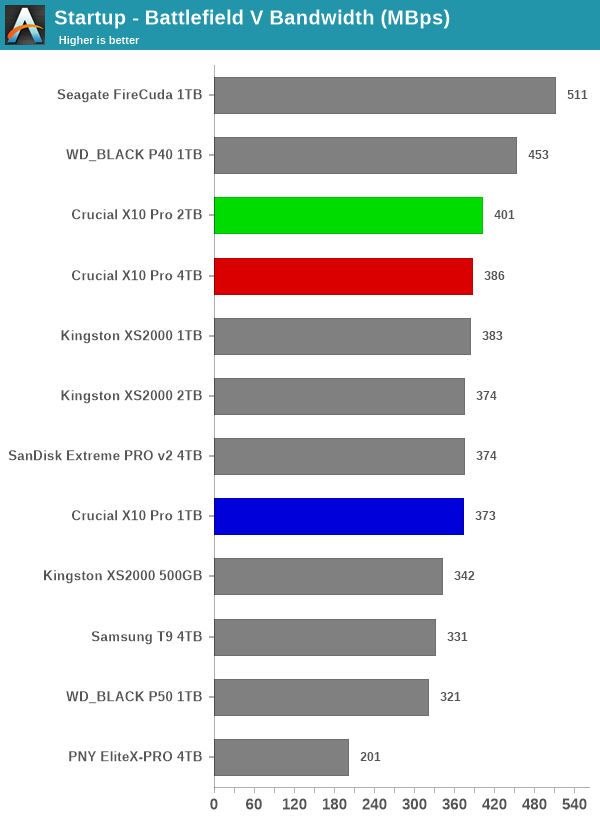
Gaming workloads are usually heavy on sequential reads, though throwing different file sizes into the mix may result in unexpected performance losses. While the Battlefield V workload sees the X10 Pro SKUs in the top half, the other two workloads see them slipping down.
Files Transfer Workloads
The read-write bandwidth recorded for each drive in the cp1, cp2, cp3, cps1, cps2, and cps3 access traces are presented below.
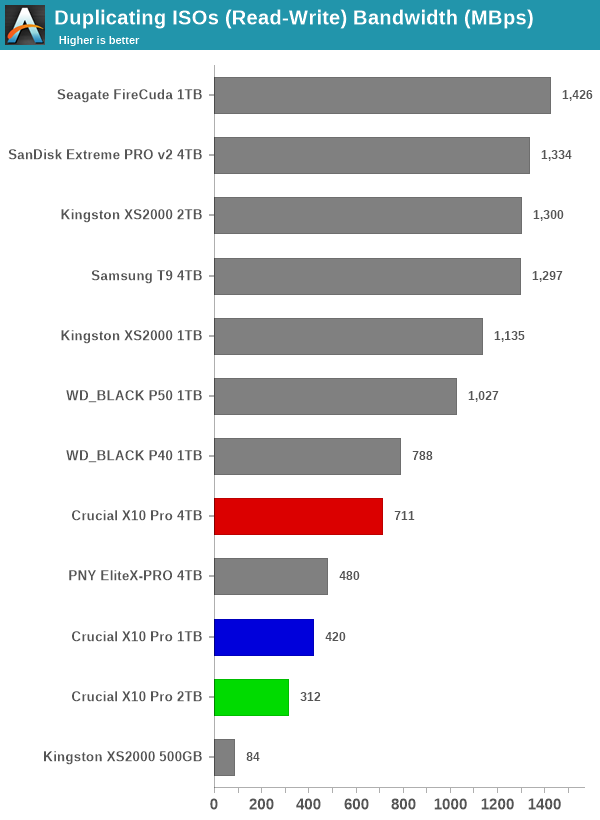
Pure large-sized reads work well for the X10 Pro SKUs. However, the insertion of smaller file sizes brings them down to the middle of the pack, and the mixture of both reads and writes pushes them down to the very bottom. This behavior is only to be expected from PSSDs based on DRAM-less native UFD controllers, particularly when the comparison mix includes high-end bridge-based solutions.
Overall Scores
PCMark 10 reports an overall score based on the observed bandwidth and access times for the full workload set. The score, bandwidth, and average access latency for each of the drives are presented below.
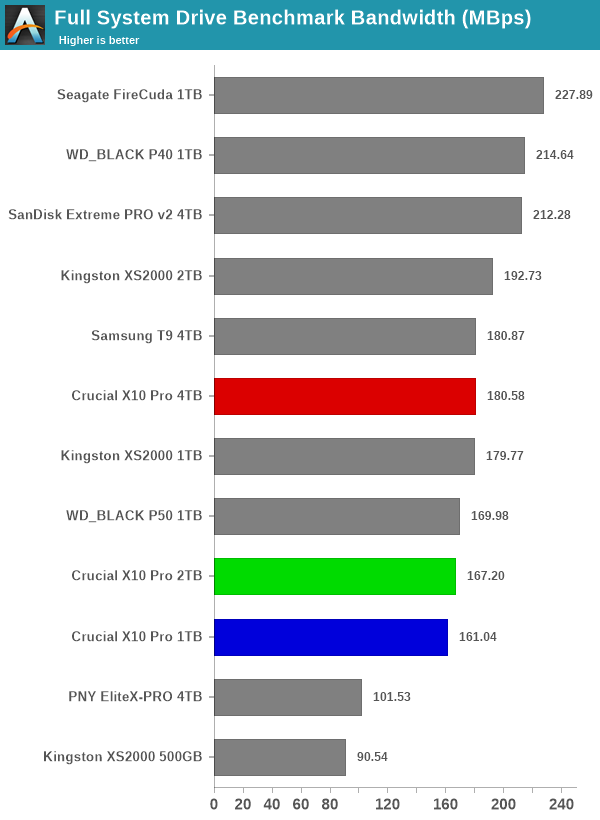
The three SKUs appear in the bottom half of the pack, with the 4TB version slotting in just below the recently-introduced bridge-based DRAM-less Samsung T9. This is a creditable result, given that the mix includes high-end bridge-based solutions.


18 Comments
View All Comments
timecop1818 - Friday, November 10, 2023 - link
How come there's no internal pics? Or is the enclosure not possible to disassemble without breaking?meacupla - Friday, November 10, 2023 - link
I have an X9, and it's welded shutPeachNCream - Friday, November 10, 2023 - link
"The increasing popularity of portable SSDs has prompted almost all tier-one NAND flash manufacturers to jump into the market."I'm not saying its not factual, but plowing open an article with an unsupported assertion does not lend credibility to the information that follows.
lmcd - Saturday, November 11, 2023 - link
dude just search usb ssd on amazonPeachNCream - Friday, November 10, 2023 - link
"Both these drives used QLC NAND, making it suitable only for mainstream consumers on a budget."What? Readers here generally understand the underlying technologies at play, but why is QLC NAND unsuitable for anyone other than a vague, ill-defined category of "mainstream" users? What use cases are you arguing for here? From my perspective, it looks like an amateurish attempt to add word count and fluff to a piece. Between that and the other unsupported fluff starting that paragraph, it just looks like the writing here is half-baked at best.
lmcd - Saturday, November 11, 2023 - link
Its performance stinks once you get past the SLC cache. Read the full article?jvl - Monday, November 13, 2023 - link
Truth be told, one year ago I checked these and decided for a Kingston XS2000. I explicitly figured that after 230 s of writing with ~1.7 GB/s (i.e., ~390 GB) I'd be making my coffee anyway or multitask away. Besides, writing that kind of volume on what is essentially a thumbdrive, dunno, I'd prefer a NAS or network connection.Maybe proprietary formats demand writing bulk for creative workloads? Not my area..
TheinsanegamerN - Friday, December 1, 2023 - link
Because the performance of QLC sucks massive balls? It literally hits HDD speed on anything larger then a NES game. How about atrocious cold data retention, terrible write durability, ece?PeachNCream - Friday, November 10, 2023 - link
"The performance specifications of these two products indicate suitability for power users - for the first time, the company is quoting write speeds for their PSSDs in the marketing material."Power users won't be okay with waiting a few seconds longer for an external drive to write data? Another ill-defined, vague categorical classification with no use cases to explain. I'm so turned off by the fuzzy writing. It's almost like this article was written by someone who had Discord open on a second screen and was splitting their attention and focus onto another task during both the draft and editing/cleanup process.
Dr_b_ - Saturday, December 2, 2023 - link
I have to agree with you about the fluff, not necessarily going to savage them as bad as you are but what you are saying is correct. Having to skip/skim past the entire first part of the review to get to the substance is bad.