The Xeon Entry Quad-Core CPU Review: Xeon E-2174G, E-2134, and E-2104G Tested
by Ian Cutress on March 11, 2019 10:30 AM EST- Posted in
- CPUs
- Xeon
- Enterprise CPUs
- Coffee Lake
- Xeon E
- C246
CPU Performance: Office Tests
The Office test suite is designed to focus around more industry standard tests that focus on office workflows, system meetings, some synthetics, but we also bundle compiler performance in with this section. For users that have to evaluate hardware in general, these are usually the benchmarks that most consider.
All of our benchmark results can also be found in our benchmark engine, Bench.
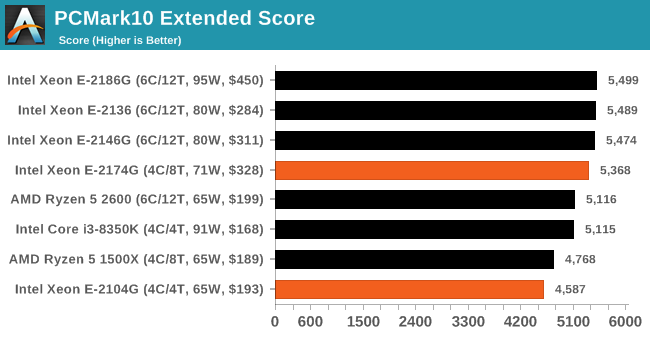
PCMark 10: Industry Standard System Profiler
Futuremark, now known as UL, has developed benchmarks that have become industry standards for around two decades. The latest complete system test suite is PCMark 10, upgrading over PCMark 8 with updated tests and more OpenCL invested into use cases such as video streaming.
PCMark splits its scores into about 14 different areas, including application startup, web, spreadsheets, photo editing, rendering, video conferencing, and physics. We post all of these numbers in our benchmark database, Bench, however the key metric for the review is the overall score.
Chromium Compile: Windows VC++ Compile of Chrome 56
A large number of AnandTech readers are software engineers, looking at how the hardware they use performs. While compiling a Linux kernel is ‘standard’ for the reviewers who often compile, our test is a little more varied – we are using the windows instructions to compile Chrome, specifically a Chrome 56 build from March 2017, as that was when we built the test. Google quite handily gives instructions on how to compile with Windows, along with a 400k file download for the repo.
In our test, using Google’s instructions, we use the MSVC compiler and ninja developer tools to manage the compile. As you may expect, the benchmark is variably threaded, with a mix of DRAM requirements that benefit from faster caches. Data procured in our test is the time taken for the compile, which we convert into compiles per day.
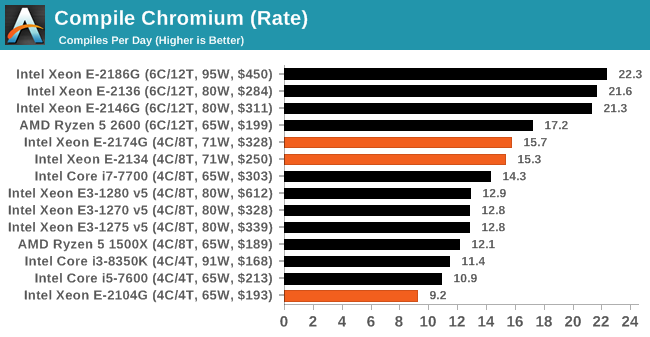
The higher E-2174G gets a small lead over the E-2134, but in this case having more threads helps, so even the E-2136 can beat the E-2174G.
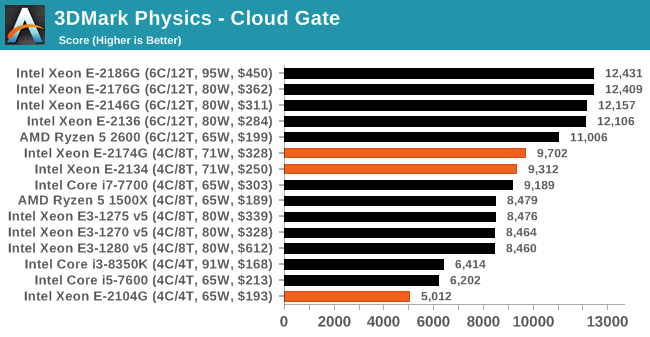
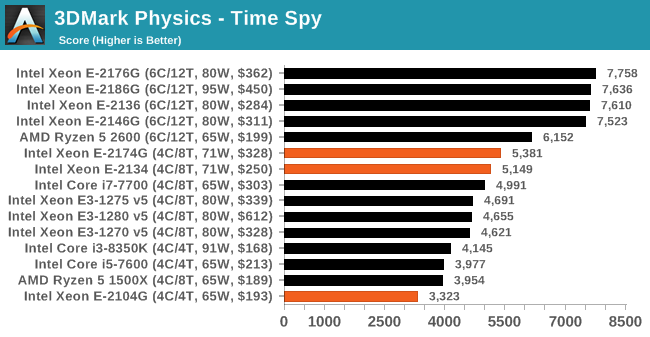
3DMark Physics: In-Game Physics Compute
Alongside PCMark is 3DMark, Futuremark’s (UL’s) gaming test suite. Each gaming tests consists of one or two GPU heavy scenes, along with a physics test that is indicative of when the test was written and the platform it is aimed at. The main overriding tests, in order of complexity, are Ice Storm, Cloud Gate, Sky Diver, Fire Strike, and Time Spy.
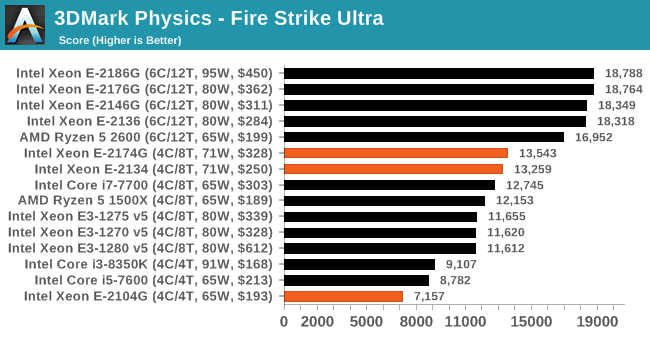
Some of the subtests offer variants, such as Ice Storm Unlimited, which is aimed at mobile platforms with an off-screen rendering, or Fire Strike Ultra which is aimed at high-end 4K systems with lots of the added features turned on. Time Spy also currently has an AVX-512 mode (which we may be using in the future).
For our tests, we report in Bench the results from every physics test, but for the sake of the review we keep it to the most demanding of each scene: Ice Storm Unlimited, Cloud Gate, Sky Diver, Fire Strike Ultra, and Time Spy.

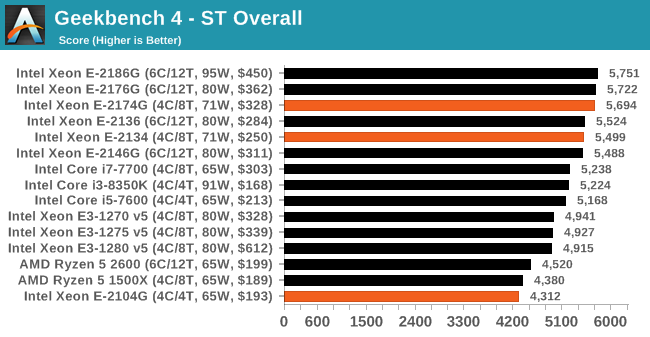
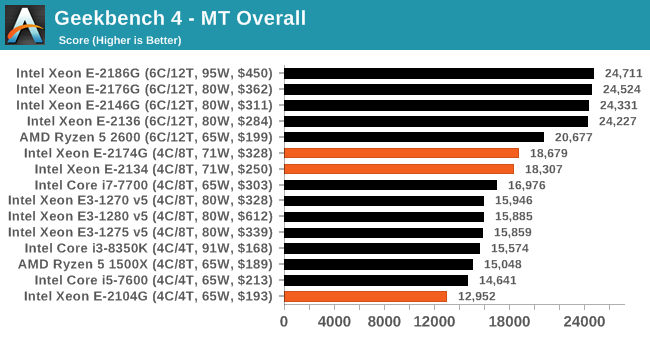
GeekBench4: Synthetics
A common tool for cross-platform testing between mobile, PC, and Mac, GeekBench 4 is an ultimate exercise in synthetic testing across a range of algorithms looking for peak throughput. Tests include encryption, compression, fast Fourier transform, memory operations, n-body physics, matrix operations, histogram manipulation, and HTML parsing.
I’m including this test due to popular demand, although the results do come across as overly synthetic, and a lot of users often put a lot of weight behind the test due to the fact that it is compiled across different platforms (although with different compilers).
We record the main subtest scores (Crypto, Integer, Floating Point, Memory) in our benchmark database, but for the review we post the overall single and multi-threaded results.


29 Comments
View All Comments
dgingeri - Monday, March 11, 2019 - link
It would be interesting to get comparative data on the 2124G and the 2126G to see if 4/8 or 6/6 would perform better.dgingeri - Monday, March 11, 2019 - link
er, sorry, meant the 2144G, not the 2124G.Stuka87 - Wednesday, March 13, 2019 - link
In my experience, real cores perform better than hyper-threaded cores. So I would be on the 6/6.yankeeDDL - Monday, March 11, 2019 - link
Is it me of the $328 xeon often loses (and sometimes by a sizable margin) to the $199 Ryzen 2600?RSAUser - Monday, March 11, 2019 - link
Definitely, but here the power envelope is important for the test, which Anandtech doesn't seem to give. It's quite worrisome how most of those Xeons are operating outside of their power envelope, that E-2174G that you are referring to is pulling 85W for a rated 71W, so Intel gives a P2 power limit. Why bother with the normal TDP then? The 2600 seems to be owning price/performance and TDP/performance. Question there is EEC memory support, and the guarantee/testing including with Xeons. That's why I mentioned including TR in the benchmarks, or at least the 2700X.This is going to be interesting when AMD releases their 7nm products.
SaturnusDK - Monday, March 11, 2019 - link
All AMD CPUs based on Zen or Zen+ supports EEC RAM. It's up to the MB manufacturer if they have included the support on their MBs. For any workstation build where you don't need the memory bandwidth or superior number of PCIe lanes the TR series offer, you'd use the Ryzen Pro series, not the consumer desktop series.mode_13h - Monday, March 11, 2019 - link
I seem to recall reading that at least some of the Zen-based APUs are lacking ECC-support. I'd love to be proven wrong...notashill - Tuesday, March 12, 2019 - link
AMD has directly confirmed that all Raven Ridge APUs support ECC.https://forums.anandtech.com/threads/amd-ama-start...
Yorgos - Sunday, March 17, 2019 - link
You seem to know nothing.ondma - Monday, March 11, 2019 - link
The 2600 goes over its TDP as well. It actually goes over its TDP by 20%, pretty much the same percentage as the hex core Intel cpus. And as usual, Anand is using an antiquated dgpu for the gaming tests.