The Intel Core i9-9900K at 95W: Fixing The Power for SFF
by Ian Cutress on November 29, 2018 8:00 AM ESTCPU Performance: Encoding Tests
With the rise of streaming, vlogs, and video content as a whole, encoding and transcoding tests are becoming ever more important. Not only are more home users and gamers needing to convert video files into something more manageable, for streaming or archival purposes, but the servers that manage the output also manage around data and log files with compression and decompression. Our encoding tasks are focused around these important scenarios, with input from the community for the best implementation of real-world testing.
All of our benchmark results can also be found in our benchmark engine, Bench.
Handbrake 1.1.0: Streaming and Archival Video Transcoding
A popular open source tool, Handbrake is the anything-to-anything video conversion software that a number of people use as a reference point. The danger is always on version numbers and optimization, for example the latest versions of the software can take advantage of AVX-512 and OpenCL to accelerate certain types of transcoding and algorithms. The version we use here is a pure CPU play, with common transcoding variations.
We have split Handbrake up into several tests, using a Logitech C920 1080p60 native webcam recording (essentially a streamer recording), and convert them into two types of streaming formats and one for archival. The output settings used are:
- 720p60 at 6000 kbps constant bit rate, fast setting, high profile
- 1080p60 at 3500 kbps constant bit rate, faster setting, main profile
- 1080p60 HEVC at 3500 kbps variable bit rate, fast setting, main profile
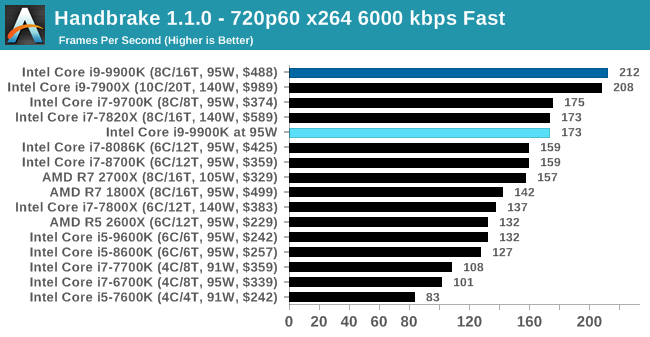
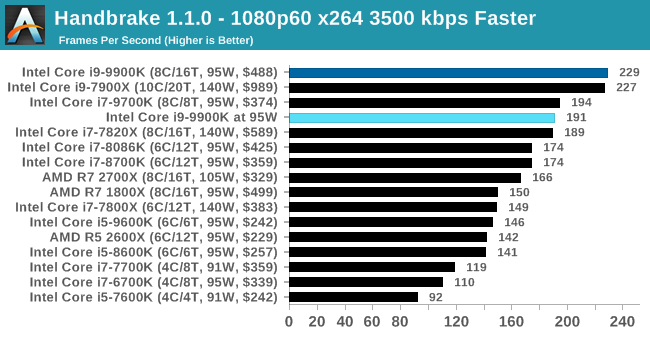
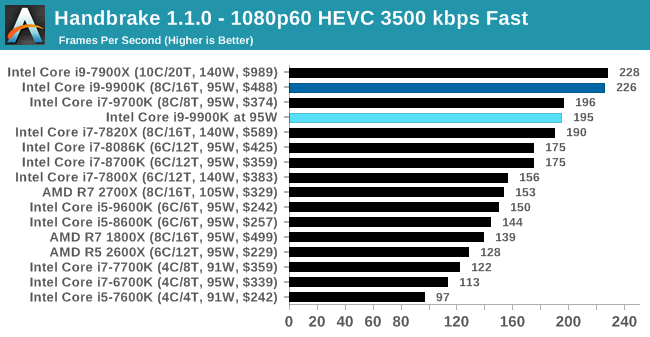
Encoding is a good example where the performance decreases by a noticable margin (10%+), although perhaps not as much as you might think. In all of our tests however, the 95W mode again pulls the 9900K down to the level of a 9700K. This pattern goes through all of our encoding tests.
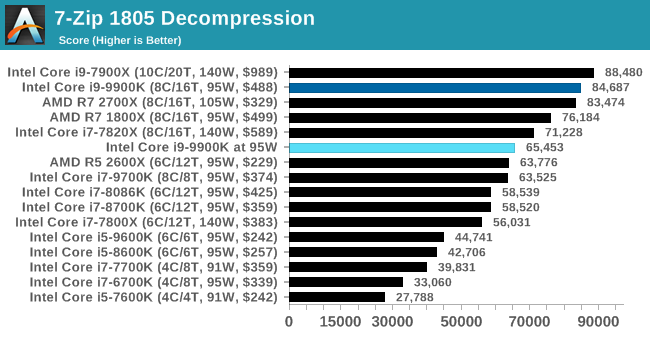
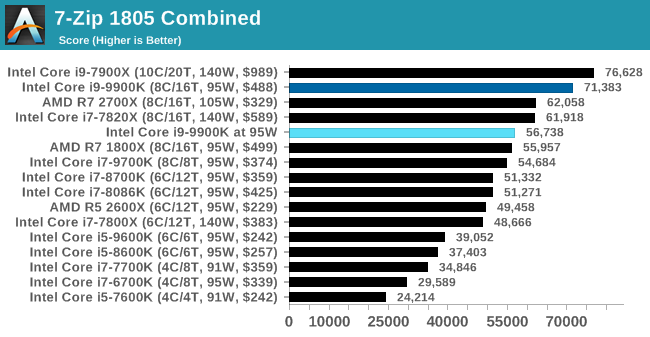
7-zip v1805: Popular Open-Source Encoding Engine
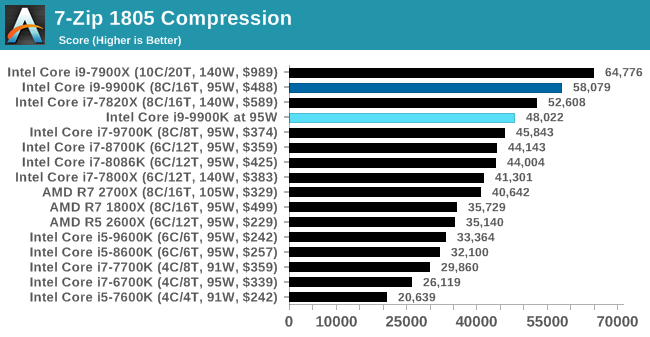
Out of our compression/decompression tool tests, 7-zip is the most requested and comes with a built-in benchmark. For our test suite, we’ve pulled the latest version of the software and we run the benchmark from the command line, reporting the compression, decompression, and a combined score.
It is noted in this benchmark that the latest multi-die processors have very bi-modal performance between compression and decompression, performing well in one and badly in the other. There are also discussions around how the Windows Scheduler is implementing every thread. As we get more results, it will be interesting to see how this plays out.
Please note, if you plan to share out the Compression graph, please include the Decompression one. Otherwise you’re only presenting half a picture.
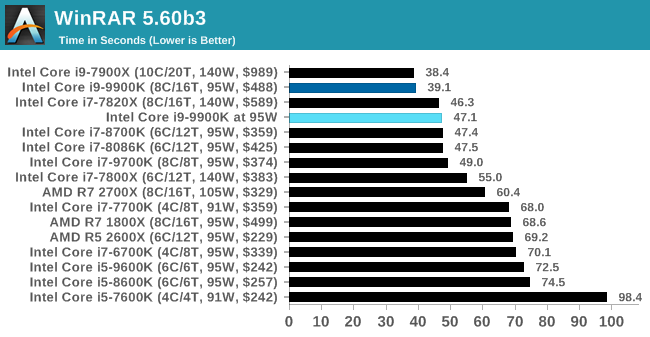
WinRAR 5.60b3: Archiving Tool
My compression tool of choice is often WinRAR, having been one of the first tools a number of my generation used over two decades ago. The interface has not changed much, although the integration with Windows right click commands is always a plus. It has no in-built test, so we run a compression over a set directory containing over thirty 60-second video files and 2000 small web-based files at a normal compression rate.
WinRAR is variable threaded but also susceptible to caching, so in our test we run it 10 times and take the average of the last five, leaving the test purely for raw CPU compute performance.
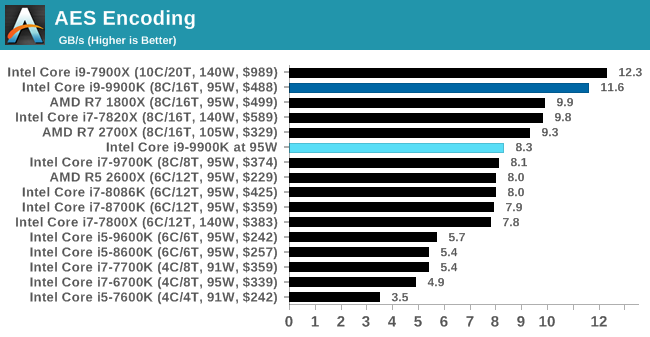
AES Encryption: File Security
A number of platforms, particularly mobile devices, are now offering encryption by default with file systems in order to protect the contents. Windows based devices have these options as well, often applied by BitLocker or third-party software. In our AES encryption test, we used the discontinued TrueCrypt for its built-in benchmark, which tests several encryption algorithms directly in memory.
The data we take for this test is the combined AES encrypt/decrypt performance, measured in gigabytes per second. The software does use AES commands for processors that offer hardware selection, however not AVX-512.


101 Comments
View All Comments
duploxxx - Thursday, November 29, 2018 - link
Interesting in a way that there are so many people that always believe in benchmarking and that in real world all cores are always idle....The world of wonders. Artificial TDP, turbo modes and decreased frequency when running multiple cores. All to fool consumers and benchmark believers.
Very nice review. Now the question:
can this also be tested on a Ryzen 2700 and a 8700K and a 9900. Put all 3 albeit in a different setup on a stock or even reduced cooling device and see how they behave....
olde94 - Thursday, November 29, 2018 - link
I see why you are intested, but both 2700 and 8700k are actually quite close in power use to their rated TDP. The issue was that the 9900k wasn't at all. If you see the power/performance graph on the last page, i think you have your answer ;)notashill - Thursday, November 29, 2018 - link
It's almost a very nice graph but could really stand to have a few more CPUs labeled. I mean even the literal headlining CPU that the entire article is about isn't labeled.And trying to compare to the POV-Ray results earlier in the article either a bunch of the CPUs are missing or the scale on the chart does not actually match the labels.
duploxxx - Thursday, November 29, 2018 - link
according anandtech measurements:2700x 105w rated buring 117.18
8700k 95w rated buring 145.71
9900k 95w rated burning 168.45
so no i ma not kidding. even the 8700k will have reduced performance with real tdp limit vs glorious benchmarking with best of best mobo and cooling.
4800z - Thursday, November 29, 2018 - link
No the 9900k and 8700k would have no lower performance on games. This only comes up when maxing out all cores for things like cinibench.TheinsanegamerN - Thursday, November 29, 2018 - link
Unless a game pushed those TDPs up. Games that can use many cores at once, like CIV and battlefield. You know, two minor franchises nobody would notice.....rhysiam - Friday, November 30, 2018 - link
There's a big difference between starting to use 6-8 cores (like Civ & BF) and hitting all those cores with a heavy load for a sustained period. Show me a game benchmark that has the 9900K literally doubling the performance of a 7700K and then you'll have a game that can push the 9900K well past its 95W tdp.Game streaming from a single PC would certainly do that, but I'd hopefully streamers are doing some research and choosing hardware carefully.
To be clear, I'm not defending Intel here, the tdp figure has become a joke, but we're a long way from this being a widespread issue for gaming workloads.
mr_fokyou - Thursday, November 29, 2018 - link
not if you are streaming while gaming than you are very much bottlenecking 9900k if u force TDP limitsbananaforscale - Saturday, December 1, 2018 - link
You are assuming no game uses all the cores (or enough that they go above TDP). The assumption is incorrect now and it will become more incorrect as quad core becomes the minimum.Samus - Saturday, December 1, 2018 - link
I think it's totally insane a CPU can use 25-27% more power than its advertised rating. Sure, that includes more performance, but as a system builder this has got to be a liability if you are putting together, say, a little 1U rack for video encoding security camera feeds. You would use a specified CPU based on its performance AND advertised TDP rating, only to find out to GET that performance, it needs to go well beyond its TDP rating, which likely wont be possible in a tiny rack with a 1U cooler (I don't believe they make 1U coolers rated beyond 105W - and those are incredibly rare, most are 73w-88w)