The Intel Core i9-9900K at 95W: Fixing The Power for SFF
by Ian Cutress on November 29, 2018 8:00 AM ESTCPU Performance: Rendering Tests
Rendering is often a key target for processor workloads, lending itself to a professional environment. It comes in different formats as well, from 3D rendering through rasterization, such as games, or by ray tracing, and invokes the ability of the software to manage meshes, textures, collisions, aliasing, physics (in animations), and discarding unnecessary work. Most renderers offer CPU code paths, while a few use GPUs and select environments use FPGAs or dedicated ASICs. For big studios however, CPUs are still the hardware of choice.
All of our benchmark results can also be found in our benchmark engine, Bench.
Corona 1.3: Performance Render
An advanced performance based renderer for software such as 3ds Max and Cinema 4D, the Corona benchmark renders a generated scene as a standard under its 1.3 software version. Normally the GUI implementation of the benchmark shows the scene being built, and allows the user to upload the result as a ‘time to complete’.
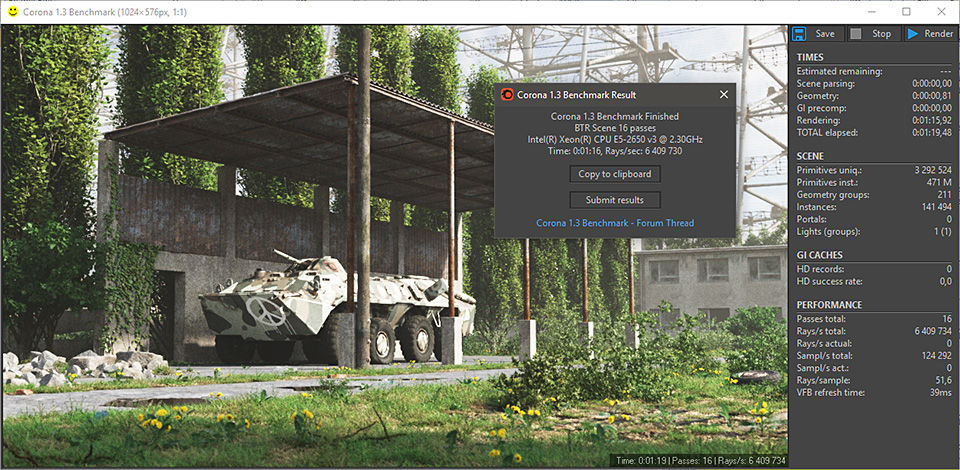
We got in contact with the developer who gave us a command line version of the benchmark that does a direct output of results. Rather than reporting time, we report the average number of rays per second across six runs, as the performance scaling of a result per unit time is typically visually easier to understand.
The Corona benchmark website can be found at https://corona-renderer.com/benchmark
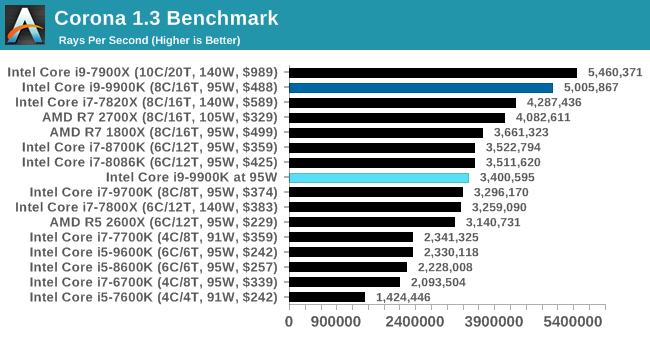
When we apply a full-fat rendering test, the 9900K at 95W scores around the i7-9700K which is a similar CPU with no hyperthreading.
Blender 2.79b: 3D Creation Suite
A high profile rendering tool, Blender is open-source allowing for massive amounts of configurability, and is used by a number of high-profile animation studios worldwide. The organization recently released a Blender benchmark package, a couple of weeks after we had narrowed our Blender test for our new suite, however their test can take over an hour. For our results, we run one of the sub-tests in that suite through the command line - a standard ‘bmw27’ scene in CPU only mode, and measure the time to complete the render.
Blender can be downloaded at https://www.blender.org/download/
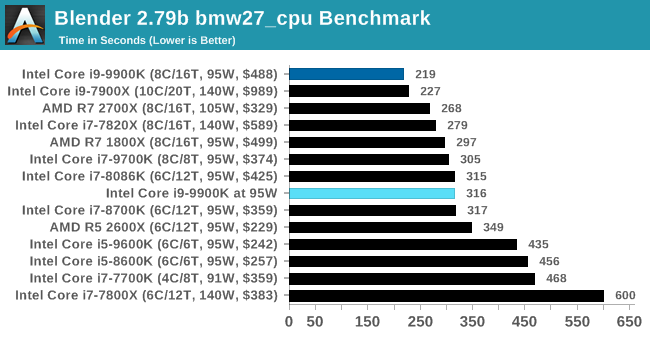
Similar scenes with Blender, where the 9900K at 95W is actually 50% slower, and performs around the mark of the 9700K.
LuxMark v3.1: LuxRender via Different Code Paths
As stated at the top, there are many different ways to process rendering data: CPU, GPU, Accelerator, and others. On top of that, there are many frameworks and APIs in which to program, depending on how the software will be used. LuxMark, a benchmark developed using the LuxRender engine, offers several different scenes and APIs.
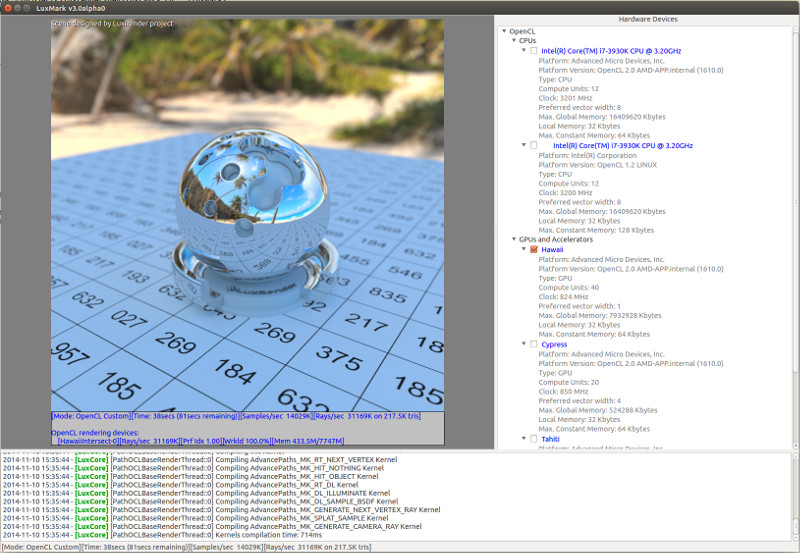
In our test, we run the simple ‘Ball’ scene on both the C++ and OpenCL code paths, but in CPU mode. This scene starts with a rough render and slowly improves the quality over two minutes, giving a final result in what is essentially an average ‘kilorays per second’.
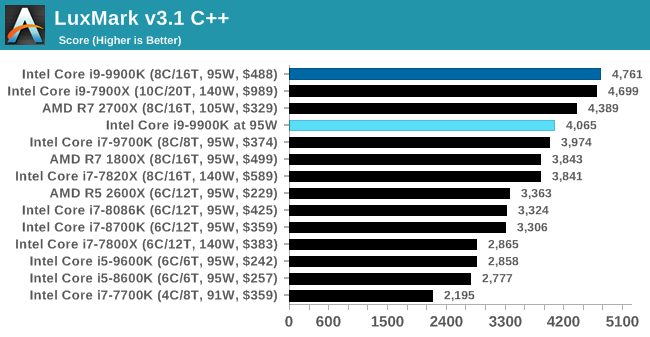
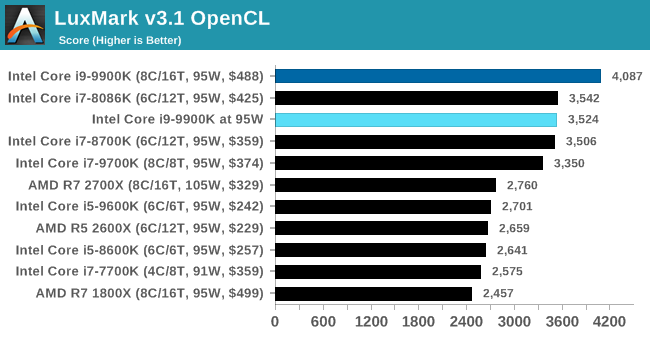
The drop in our Luxmark test isn't as severe as what we see in blender, but the 95W mode causes the 9900K to be again around the level of a 9700K.
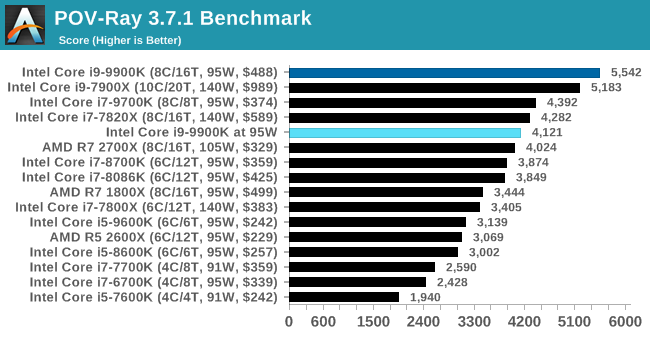
POV-Ray 3.7.1: Ray Tracing
The Persistence of Vision ray tracing engine is another well-known benchmarking tool, which was in a state of relative hibernation until AMD released its Zen processors, to which suddenly both Intel and AMD were submitting code to the main branch of the open source project. For our test, we use the built-in benchmark for all-cores, called from the command line.
POV-Ray can be downloaded from http://www.povray.org/


101 Comments
View All Comments
duploxxx - Thursday, November 29, 2018 - link
Interesting in a way that there are so many people that always believe in benchmarking and that in real world all cores are always idle....The world of wonders. Artificial TDP, turbo modes and decreased frequency when running multiple cores. All to fool consumers and benchmark believers.
Very nice review. Now the question:
can this also be tested on a Ryzen 2700 and a 8700K and a 9900. Put all 3 albeit in a different setup on a stock or even reduced cooling device and see how they behave....
olde94 - Thursday, November 29, 2018 - link
I see why you are intested, but both 2700 and 8700k are actually quite close in power use to their rated TDP. The issue was that the 9900k wasn't at all. If you see the power/performance graph on the last page, i think you have your answer ;)notashill - Thursday, November 29, 2018 - link
It's almost a very nice graph but could really stand to have a few more CPUs labeled. I mean even the literal headlining CPU that the entire article is about isn't labeled.And trying to compare to the POV-Ray results earlier in the article either a bunch of the CPUs are missing or the scale on the chart does not actually match the labels.
duploxxx - Thursday, November 29, 2018 - link
according anandtech measurements:2700x 105w rated buring 117.18
8700k 95w rated buring 145.71
9900k 95w rated burning 168.45
so no i ma not kidding. even the 8700k will have reduced performance with real tdp limit vs glorious benchmarking with best of best mobo and cooling.
4800z - Thursday, November 29, 2018 - link
No the 9900k and 8700k would have no lower performance on games. This only comes up when maxing out all cores for things like cinibench.TheinsanegamerN - Thursday, November 29, 2018 - link
Unless a game pushed those TDPs up. Games that can use many cores at once, like CIV and battlefield. You know, two minor franchises nobody would notice.....rhysiam - Friday, November 30, 2018 - link
There's a big difference between starting to use 6-8 cores (like Civ & BF) and hitting all those cores with a heavy load for a sustained period. Show me a game benchmark that has the 9900K literally doubling the performance of a 7700K and then you'll have a game that can push the 9900K well past its 95W tdp.Game streaming from a single PC would certainly do that, but I'd hopefully streamers are doing some research and choosing hardware carefully.
To be clear, I'm not defending Intel here, the tdp figure has become a joke, but we're a long way from this being a widespread issue for gaming workloads.
mr_fokyou - Thursday, November 29, 2018 - link
not if you are streaming while gaming than you are very much bottlenecking 9900k if u force TDP limitsbananaforscale - Saturday, December 1, 2018 - link
You are assuming no game uses all the cores (or enough that they go above TDP). The assumption is incorrect now and it will become more incorrect as quad core becomes the minimum.Samus - Saturday, December 1, 2018 - link
I think it's totally insane a CPU can use 25-27% more power than its advertised rating. Sure, that includes more performance, but as a system builder this has got to be a liability if you are putting together, say, a little 1U rack for video encoding security camera feeds. You would use a specified CPU based on its performance AND advertised TDP rating, only to find out to GET that performance, it needs to go well beyond its TDP rating, which likely wont be possible in a tiny rack with a 1U cooler (I don't believe they make 1U coolers rated beyond 105W - and those are incredibly rare, most are 73w-88w)