Launching the #CPUOverload Project: Testing Every x86 Desktop Processor since 2010
by Dr. Ian Cutress on July 20, 2020 1:30 PM ESTGaming Tests: Gears Tactics
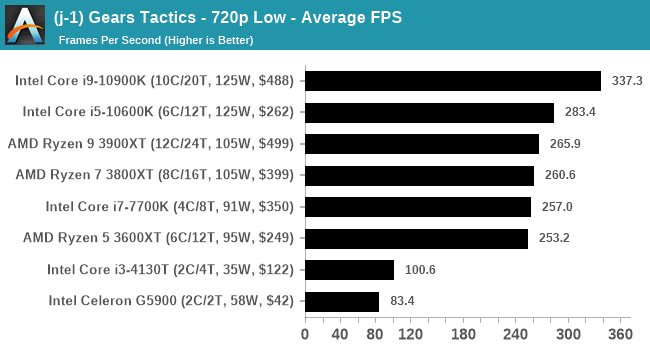
Remembering the original Gears of War brings back a number of memories – some good, some involving online gameplay. The latest iteration of the franchise was launched as I was putting this benchmark suite together, and Gears Tactics is a high-fidelity turn-based strategy game with an extensive single player mode. As with a lot of turn-based games, there is ample opportunity to crank up the visual effects, and here the developers have put a lot of effort into creating effects, a number of which seem to be CPU limited.

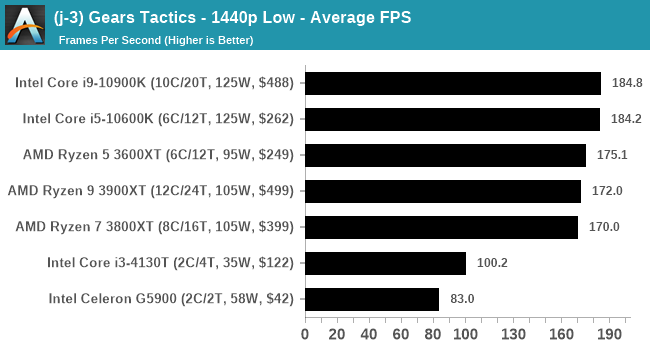
Gears Tactics has an in-game benchmark, roughly 2.5 minutes of AI gameplay starting from the same position but doing slightly different things each time. Much like the racing games, this usually leads to some variation in the run-to-run data, so for this benchmark we are taking the geometric mean of the results. One of the biggest things that Gears Tactics can do is on the resolution scaling, supporting 8K, and so we are testing the following settings:
- 720p Low
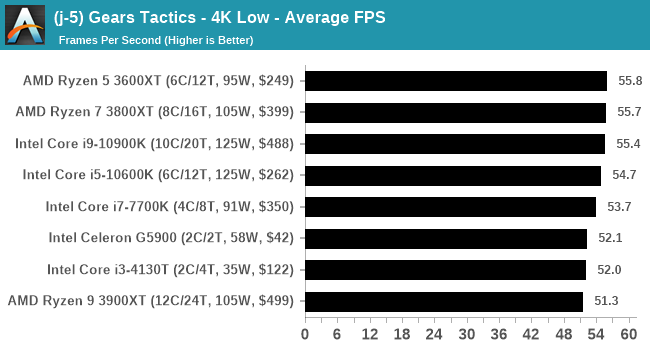
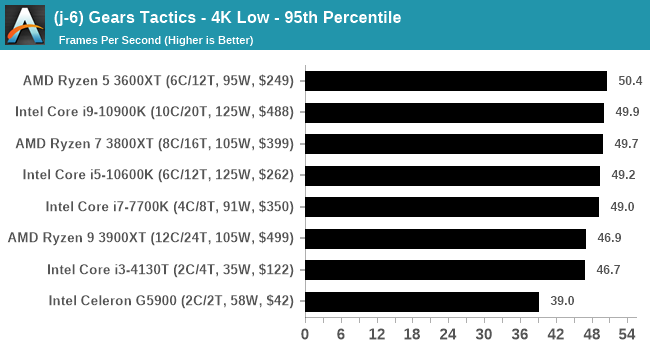
- 4K Low
- 8K Low
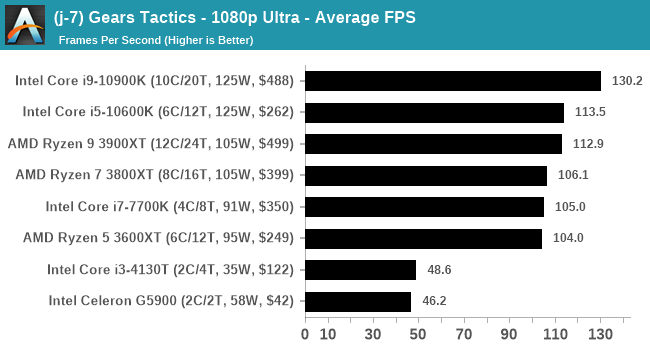
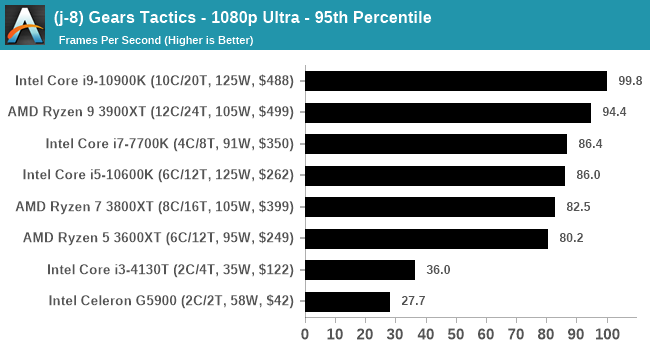
- 1080p Ultra
For automation, Gears Tactics falls under one of our more frustrating titles. The resolution and quality are taken from a settings file, and this is easily transferable between machines. However one part of the settings file cannot be transferred – a specific hardwareID created by the CPU+GPU combination. To get this, we load up the game first without a settings file so it generates the value, then we extract that value to use in our pre-prepared settings files.
There is no command line option to get to the benchmark, and so we load up the game and have to navigate to the benchmark mode. While I was testing for this article, the game introduced an intro splash screen notifying users of an update, which meant I had to script a way to cancel that screen without exiting the game – luckily there was a small segment of the ‘accept’ box that doesn’t cover the ‘exit game’ box when the intro splash screen disappears (so it should be valid when that splash screen is removed, or replaced).
By far the biggest issue with the benchmark is the results output. The game showcases a mountain of data when the benchmark is finished, such as how much the benchmark was CPU limited and where, however none of that is ever exported into a file we can use. It’s just a screenshot which we have to read manually. If the developers could output all this data that they’ve clearly recorded and shown to the user, it would make my job a lot easier. I did consider putting the benchmark in a FRAPs wrapper, however the loading time for the test is too variable, along with the lack of a fixed seed for the AI actions that makes the benchmark itself a bit variable in length.
As with the other benchmarks, we do as many runs until 10 minutes per resolution/setting combination has passed. For this benchmark, we manually read each of the screenshots for each quality/setting/run combination. The benchmark does also give 95th percentiles and frame averages, so we can use both of these data points.
| AnandTech | IGP | Low | Medium | High |
| Average FPS |  |
 |
 |
 |
| 95th Percentile | 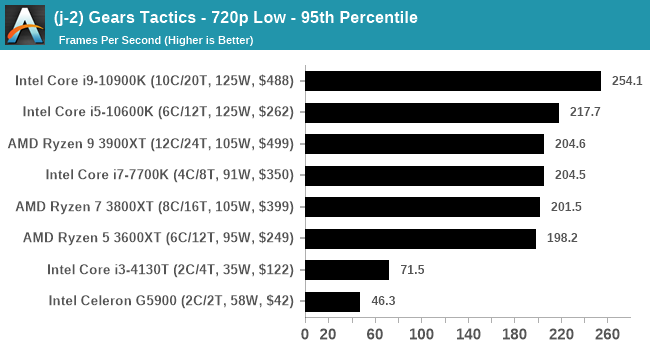 |
 |
 |
 |
All of our benchmark results can also be found in our benchmark engine, Bench.


110 Comments
View All Comments
DiHydro - Monday, July 20, 2020 - link
This is epic. Thank you for doing this.DiHydro - Monday, July 20, 2020 - link
To add a note: I think the ~$300 CPU year-over-year performance would be an interesting metric to see. That price point seems to be pretty popular for enthusiasts, and seeing back 5-6 years how that performance has increased per dollar would be neat.bldr - Monday, July 20, 2020 - link
Agree!close - Monday, July 20, 2020 - link
It will be especially interesting to see those CPUs (the popular mainstream ones) tested now and compared to the numbers they got originally to see how much they lost with all the recent mitigations.close - Tuesday, July 21, 2020 - link
Oh, because I forgot previously, congratulations and good luck with the endeavor! I got exhausted only by reading about the work you're going to have to doFozzie - Monday, July 20, 2020 - link
Except keep in mind that adjusted for inflation $200 in the year 2000 is worth over $300 now.You'd either be making a chart of the increased value over time just due to inflation or in fact the every increasing value at the $300 price point due to the reduced value of the Dollar on top of whatever performance gains occurred.
biosstar - Friday, July 24, 2020 - link
You could also use the value of a dollar in a certain year (let's say 2020) and compare the processors in the inflation adjusted equal categories.PeterCollier - Monday, July 20, 2020 - link
What's the point of this Geekbench/Userbenchmark knockoff? I've never used AT's Bench tool. Especially not for smartphones, since the Bench tool is about 5 years out of date.BushLin - Monday, July 20, 2020 - link
A controlled environment across all tests is reason enough. Even if I don't agree with AT policy on what speed they allow RAM to operate, it is a fair comparison.Byte - Monday, July 20, 2020 - link
RAM is a really important topic. I think at this point in time, we can reasonable put almost maxed out ram for every platform. Like DDR3 can run at 2133, DDR4 we can run it at 3200 as prices are so close.It is like rating sports cars but all have Goodride tires on them.
A dodge viper was a widowmaker when it came out. Today with a good set of summers like PS4S or PZero, you will have a hard time slipping even if you tried.