Original Link: https://www.anandtech.com/show/2269
Samsung SpinPoint T166 500GB: Cool, Quiet, and Quick
by Gary Key on July 9, 2007 2:00 AM EST- Posted in
- Storage
Samsung introduced the SpinPoint T166 series last fall after the P120 series had success in the market as a low cost alternative to similar offerings from Seagate, Maxtor, Hitachi, and Western Digital. While the P120 series was certainly a bargain in terms of cost, the drive series did not receive much press coverage nor did Samsung actively promote the product in the same manner you see from their competitors. However, those drives developed almost a cult following from people who perceived them as great price to performance alternatives, not to mention drives that were whisper quiet and easy on the electric bill.
We have always liked the P120 series but our experiences with earlier Samsung storage products usually ended in disappointment either through sub-par performance or reliability issues. It also seemed at times that Samsung was almost embarrassed to admit they were in the storage market as their products consistently lagged behind others in both technology and performance. Over the past two years, we have seen some dramatic changes at Samsung and they are now committed to providing class leading performance in the desktop market at the lowest possible cost.
The SpinPoint T166 series brings Samsung close (if not even) to the other manufacturers in offering performance competitive drives at somewhat discounted prices. We have also seen and experienced an improvement in both reliability and customer support to the point that we think Samsung is on the right track, if not the fast track, to meeting their goals.
From a technology viewpoint, they were first to market this year with Hybrid hard drives that feature 256MB of NAND Flash memory and full support for Vista's new ReadyBoost technology. We will take a look at this interesting meld of technology in the near future but for now they are the leaders in this developing market. Also of note will be Samsung's entry into the Perpendicular Magnetic Recording desktop market with their new F1 series.
The F1 features capacities up to 1TB utilizing a three disk design with 334GB per-platter capacities in a SATA 3Gb/s interface. Hitachi is using 200GB per-platter capacities and later this month we will see Seagate introduce their 250GB per-platter design in the new 7200.11 series. The F1 also features 32MB cache and their NoiseGuard/SilentSeek technologies with the promise to provide whisper-quiet operation and the best thermals in the 1TB range of drives. While we are excited about the specifications, we will hold off on making any judgment calls until we have tested this new drive. After all, making the jump from 167GB per-platter designs to an all new PMR drive with a 33% density improvement over the nearest competitor has its risks.
In our review today of the SpinPoint T166 500GB (HD501LJ), we will see how far Samsung has come in its drive technology, and if it stands above the competition or just merely comes close. Let's now find out how Samsung's newest drive performs against our other 500GB offerings.
Drive Specifications
| Drive Specifications | |||
| Samsung SpinPoint T166 500GB HD501LJ |
Hitachi Deskstar T7K500 500GB HDT725050VLA360 |
Seagate Barracuda 7200.10 500GB ST3500630AS |
|
| Manufacturer's Stated Capacity | 500GB | 500GB | 500GB |
| Operating System Stated Capacity | 465.8 GB | 465.8 GB | 465.8 GB |
| Interface | SATA 3Gb/s | SATA 3Gb/s | SATA 3Gb/s |
| Rotational Speed | 7,200 RPM | 7,200 RPM | 7,200 RPM |
| Cache Size | 16 MB | 16 MB | 16 MB |
| Average Latency | 4.17 ms (nominal) | 4.17 ms (nominal) | 4.16 ms (nominal) |
| Read Seek Time | 8.9 ms | 8.5 ms | 11 ms |
| Number of Heads | 6 | 6 | 6 |
| Number of Platters | 3 | 3 | 3 |
| Power Draw Idle / Load |
7.1W / 11.3W | 6.9W / 12.5W | 8.6W / 12.6W |
| Command Queuing | Native Command Queuing | Native Command Queuing | Native Command Queuing |
| Warranty | 3 Year - Retail or OEM | 3 Year - Retail or OEM | 5 Year - Retail or OEM |
When compared directly to two of its competitors within the 500GB category, we find the Samsung HD501LJ has nearly identical specs as the Hitachi and Seagate drives. The only major differences is a read seek time advantage and lower power consumption at idle for the Hitachi drive and an additional two years of warranty coverage for the Seagate drive.
Samsung has 17 variations of the T166 product series released at this time with a choice of PATA or SATA interfaces and 8MB or 16MB cache schemes. Capacities for the T166 series range from 80GB to 500GB. Our review unit is at the top of Samsung's model lineup with a 500GB capacity and SATA 3Gbps interface. This capacity is made possible by three 167GB platters spinning at 7200rpm with a 16MB cache. The current street price for this unit is around $109 making it a bargain in the 500GB market. The Hitachi and Seagate drives sell for $139 and $119 respectively.
Feature Set
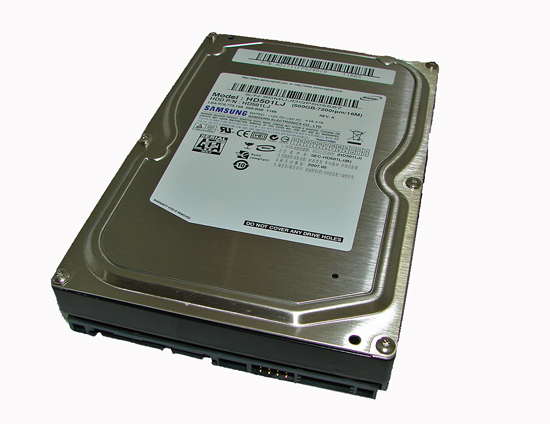
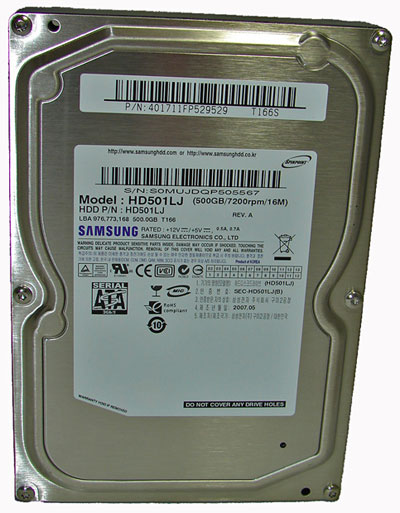
The external casing design of the SpinPoint T166 series is based on the industry standard 3.5" form factor platform with pertinent part number and warranty information embossed on a white sticker on the top of the casing. Samsung quotes a 600,000 hour Mean Time Between Failure rate that is significantly less than other drives in this category, and near-line enterprise SATA drives that hover around a 1 million to 1.2 million hour MTBF rating.
Of course, MTBF ratings are meaningless if your drive fails within a few hours of operation or a few days outside the warranty period, as is known to happen on occasion. We normally pay very little attention to MTBF ratings and instead focus on the manufacturer's stated lifetime expectancy for the drive and warranty coverage - the longer the better. Samsung lists the life expectancy of this drive under normal operating conditions to be around five years and provides a three year warranty.
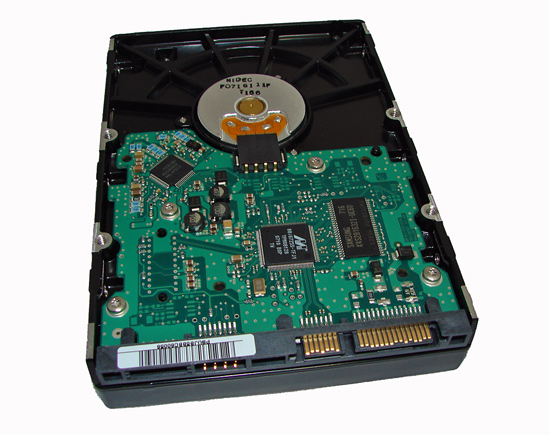
The SpinPoint T166 SATA family ships with Serial ATA data and power connectors only. There is no support for the 4-pin Molex power connector designed for use with older ATX power supplies. To the left of the data and power connectors is an eight pin jumper block. This jumper block will determine whether the drive operates in Master, Slave, or Select Cable mode if you are using a PATA model; for SATA models this jumper block has no effect.
 |
| Click to enlarge |
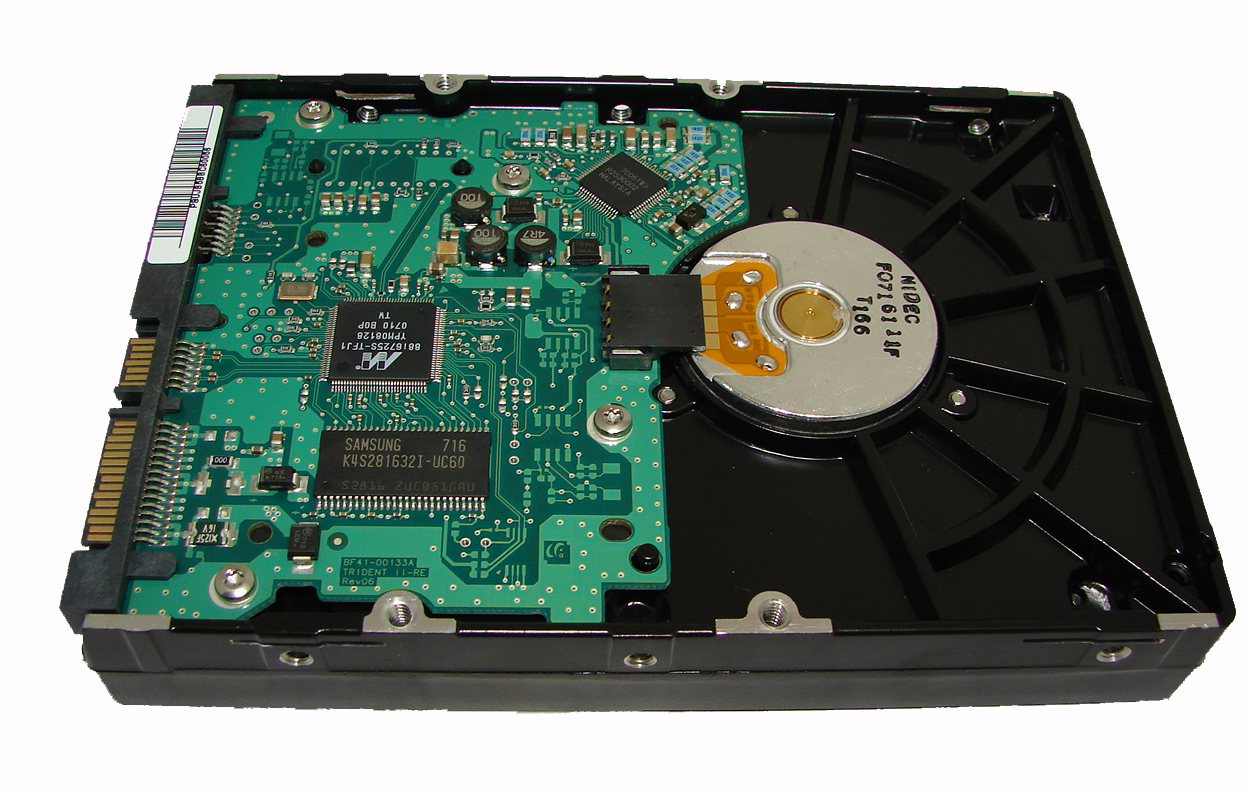
The PCB is openly visible on the bottom of the drive as in previous series and contains a Marvell controller chipset and Samsung's own memory module. In the past we have seen Samsung utilize ESMT (Elite Semiconductor Memory Technology) memory which was always surprising given the size of Samsung's memory business.
Hardware Setup
| Standard Test Bed Playback of iPEAK Trace Files and Test Application Results |
|
| Processor | Intel QX6700 - 2.66GHz Quad Core |
| Motherboard | DFI Infinity 965-S |
| RAM | 2 x 1GB OCZ Reaper PC2-9200 Settings - DDR2800 - 3-4-3-9 |
| OS Hard Drive | 1 x Western Digital WD1500 Raptor - 150GB |
| System Platform Drivers | Intel 8.1.1.1010 Intel Matrix RAID 6.2.1.1002 |
| Video Card | 1 x MSI 8800GTX |
| Video Drivers | NVIDIA Forceware 158.19 |
| Optical Drive | Plextor PX-760A, Plextor PX-B900A |
| Cooling | Tuniq 120 |
| Power Supply | Corsair HX620 |
| Case | Cooler Master CM Stacker 830 |
| Operating System | Windows XP Professional SP2 |
We are utilizing an Intel QX6700 quad core CPU to ensure we are not CPU limited in our testing. A 2GB memory configuration is standard in our XP test bed as most enthusiasts are currently purchasing this amount of RAM. Our choice of high-range OCZ Reaper PC2-9200 memory offers a very wide range of memory settings with timings of 3-4-3-9 used for our benchmark results.
Our test bed now includes a water-cooled MSI 8800 GTX video card to ensure our game tests are not completely GPU bound and to reduce noise/heat levels. Our video tests are run at 1280x1024 resolution for this article at High Quality settings. All of our tests are run in an enclosed case with a dual optical/hard drive setup to reflect a moderately loaded system platform. Windows XP SP2 is fully updated and we load a clean drive image for each system to keep driver conflicts to a minimum.
The drive is formatted before each test run and five tests are completed on each drive in order to ensure consistency in the benchmark results. The two high and low scores are removed with the remaining score representing our reported result. We utilize the Intel ICH8R SATA ports along with the latest Intel Matrix Storage driver to ensure consistency in our playback results when utilizing NCQ, TCQ, or RAID settings.
Test Setup - Software
With the variety of disk drive benchmarks available, we needed a means of comparing the true performance of the hard drives in real world applications. While we will continue to utilize HD Tach, HD Tune, and PCMark05 for comparative benchmarks our logical choice for application benchmarking is the Intel iPEAK Storage Performance Toolkit version 3. The iPEAK test can be designed to measure "pure" hard disk performance, and in this case we kept the host adapter consistent while varying the hard drive models.
We utilize the iPEAK WinTrace32 program to record precise I/O operations when running real world benchmarks. We then utilize the iPEAK AnalyzeTrace program to review the disk trace file for integrity and ensure our trace files have properly captured the activities we required. Intel's RankDisk utility is used to play back the workload of all I/O operations that took place during the recording.
RankDisk generates results in a mean service time in milliseconds format; in other words, it gives the average time that each drive took to fulfill each I/O operation. In order to make the data more understandable, we report the scores as an average number of I/O operations per second so that higher scores translate into better performance in all of our iPEAK results. While these measurements will provide a score representing "pure" hard drive performance, the actual impact on the real world applications can and will be different due to system factors.
Our iPEAK tests represent a fairly extensive cross section of applications and usage patterns for both the general and enthusiast user. We will continually tailor these benchmarks with an eye towards the drive's intended usage and feature set when compared to similar drives. Hopefully our comments in the results sections will offer proper guidance for making a purchasing decision in these situations. Our iPEAK Test Suite consists of the following benchmarks.
VeriTest Business Winstone 2004: trace file of the entire test suite that includes applications such as Microsoft Office XP, WinZip 8.1, and Norton Antivirus 2003.
VeriTest Multimedia Content Creation 2004: trace file of the entire test suite that includes applications such as Adobe Photoshop 7.01, Macromedia Director MX 9.0, Microsoft Windows Media Encoder 9.0, Newtek Lightwave 3D 7.5b, and others.
AVG Antivirus 7.5: trace file of a complete antivirus scan on our test bed hard drive.
Microsoft Disk Defragmenter: trace file of the complete defragmentation process after the operating system and all applications were installed on our test bed hard drive.
WinRAR 3.70: trace file of creating a single compressed file consisting of 444 files in 10 different folders totaling 602MB. The test is split into the time it takes to compress the files and the time it takes to decompress the files.
File Transfer: individual trace files of transferring the Office Space DVD files to our source drive and transferring the files back to our test drive. The content being transferred consists of 29 files with a content size of 7.55GB.
AnyDVD 6.1: trace file of the time it takes to "rip" the Office Space DVD. We first copy the entire DVD over to our source drives, defragment the drive, and then measure the time it takes for AnyDVD to "rip" the contents to our test drive. While this is not ideal, it does remove the optical drive as a potential bottleneck during the extraction process and allows us to track the write performance of the drive.
Nero Recode 2: trace file of the time it takes to shrink the entire Office Space DVD that was extracted in the AnyDVD process into a single 4.5GB DVD image.
Game Installation: individual trace files of the time it takes to install Sims 2 and Battlefield 2. We copy each DVD to our secondary test drives, defragment the drive, and then install each game to our source drive.
Game Play: individual trace files that capture the startup and about 15 minutes of game play in each game. The Sims 2 trace file consists of the time it takes to select a preconfigured character, setup a university, downtown, business from each expansion pack (preloaded), and then visit each section before returning home. Our final trace file utilizes Battlefield 2 and we play the Daqing Oilfield map in both single and multiplayer mode.
HD Tune / HD Tach
 |
| Click to enlarge |
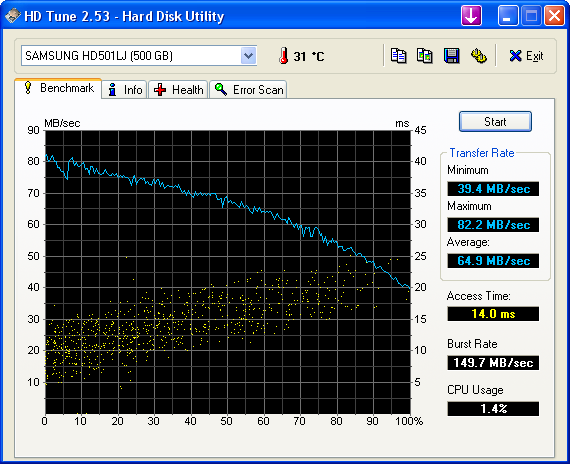
In previous HD Tune 2.53 testing the Hitachi T7K500 came in at 65.3 MB/s, Seagate's 7200.10 500GB drive at 63.1 MB/s, Western Digital's YS 500GB at 62.4 MB/s, and falling way behind at 51.5 MB/s was the Seagate 7200.9 500GB drive. The Samsung's 64.9 MB/s puts it near the Hitachi's class leading performance and slightly ahead of the Seagate drive.
With a reported read access time of 14.0ms, the Samsung drive finishes at the bottom of the pack of our 500GB drives with the Hitachi T7K500 having a 13.0ms score and the Seagate 7200.10 finishing at 13.2ms. Considering the rotational latency of a 7200 RPM spindle is generally 4.2ms, this leaves the SpinPoint T166 with a measured seek time of 9.8ms which is higher than Samsung's reported 8.9ms results.
In the HD Tach tests the sequential read speed at the 250GB level for the 500GB 7200.10, Hitachi 500GB, and WD 500GB averaged around 70 MB/s while the 7200.9 500GB was near 53 MB/s. The Samsung drive is once again very competitive with a reading right over 72 MB/s at the 250GB mark while finishing around the 40 MB/s mark at the end of the drive. As in the HD Tune tests, we a slight dip at the 25GB mark before the drive recovers back to the 80 MB/s range in the sequential read speed test.
It is important to note that access times, average read rates, and burst rate measurements are basically synthetic measurements, and while important these are not "true" application measurements. There is a great deal of potential bottlenecks elsewhere in the system that can and will affect the true performance of a drive. Although these "benchmarks" are a good indicator of a drive's performance, it is the total make-up of components in the PC that will determine the drive's actual performance.
Acoustics
Our acoustic test utilizes our standard test bed components but we implement Intel's power saving technology and turn off the case fans to isolate as much case noise as possible during testing. Our Corsair power supply is nearly silent in these tests and our MSI 8800GTX video card is water cooled by an external unit to provide a further decrease in our case's ambient noise levels. Our drives are attached to the drive cage with rubber bushings to assist in isolating the noise of the drive and avoid the resulting harmonic changes due to the case design.
Our acoustic tests are designed to measure the decibel levels while the system is at idle and also under load while running the General Hard Disk Drive Usage benchmark within PCMark 2005. We found through trial and error that this particular benchmark produces controlled readings across a wide range of applications within the benchmark. This particular benchmark utilizes 60% reads and 40% writes within the trace playback file.
The measurements are taken at a distance of 5mm from the rear and front of the drive being tested in order to minimize surrounding environmental noise. We have noticed that unless we run a completely silent system in a quiet room that measurements taken from 1m are generally not meaningful due to ambient noise levels. There are exceptions like the Raptor series of drives but overall most modern desktop drives are quieter now than the other components in the system while under load.
The reported measurements are based on an A-weighted decibel score that measures frequencies similar to the way the human ear responds to sound. We take a total of three measurements for each test. We then subtract the high and low scores and arrive at our findings by reporting the remaining score.
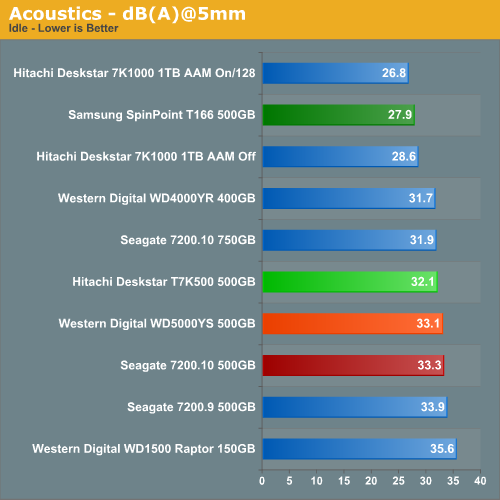
Our Samsung SpinPoint T166 drive is extremely quiet at idle and subjectively speaking we thought it was quieter than our Hitachi 1TB drive. The drive had a slight "chirping" sound during Window's polling routine that caused the slightly higher readings. Otherwise, we found the motor noise at idle to be very soft and smooth when compared to our other drives. Our ears tell us this is the quietest drive we have tested to date although our measurements disagree.
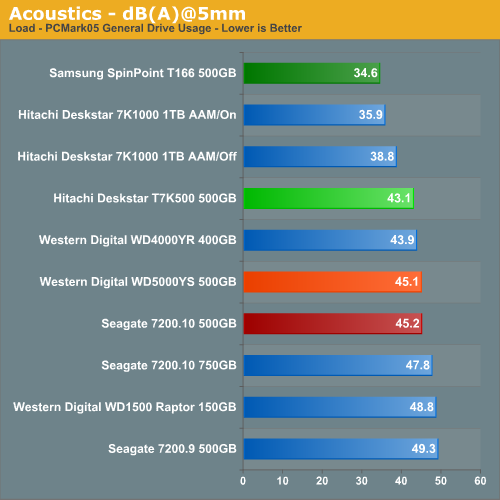
We did not have any real issues with the drive's noise levels during light operations or under heavy loads as our measurements can attest. However, during heavy read seek operations we did notice an occasional dull but much muted tone from the drive that did not show up on our objective tests. This particular drive did have a slight vibration issue within the test case when the rubber mounting grommets were removed. In fact, the case would hum at times with this drive. Our base dB(A) level in the room at the time of testing was 25 dB(A).
Thermals
Our thermal tests utilize sensor readings via the S.M.A.R.T. (Self-Monitoring, Analysis and Reporting Technology) capability of the drives and are reported by utilizing the Active SMART 2.42 utility. We also utilize thermal sensors and infrared measurement devices to verify our utility results. We test our drives in an enclosed case environment without the fans operational to simulate temperatures that could conceivably be reached in a near silent SFF or HTPC case design. We typically find the reported numbers drop anywhere from 18% to 25% on average with the case fans operational. Our base temperature level in the room at the time of testing was 25C.
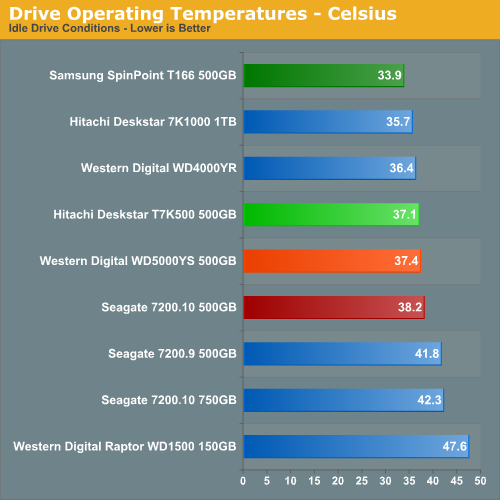
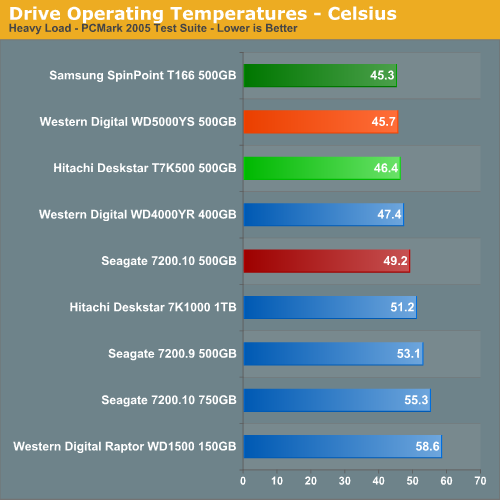
Our Samsung drive was 3.2C cooler at idle than our Hitachi T7K500 even though power consumption was slightly higher. The SpinPoint T166 also had the best load operating temperatures and the casing actually felt cooler than our readings indicated. Pardon the pun, but this is one cool drive. We saw the load temperatures drop from 45C to 38C under load conditions with the front fans operational.
PCMark05 Performance
We are utilizing the HDD test suite within PCMark05 for further comparative hard disk scores as it provides a mixture of actual application results and specific read/write percentages utilized within these programs. It is also a readily available benchmark that others can use for comparative purposes. The program utilizes the RankDisk application within the Intel iPEAK SPT suite of tools to record a trace of disk activity during usage of real world applications. These traces are then replayed to generate performance measurements based upon the actual disk operations within each application. The HDD test suite contains 53% read and 47% write operations with each trace section utilizing varied amounts of read or write operations. Additional information about the test suite can be found in PDF format here PCMark05 whitepaper.
The PCMark05 test results are based upon the following trace runs:
Windows XP Startup: This test consists of 90% reading and 10% writes that tracks XP activities at start-up.
Application Loading: This test consists of 83% reading and 17% writes that tracks the opening and closing of the following programs.
- Microsoft Word
- Adobe Acrobat Reader
- Windows Media Player
- 3Dmark 2001SE
- Leadtek WinFast DVD
- Mozilla Internet Browser
- Opening a Microsoft Word document, performing grammar check, saving and closing
- Compression and decompression using WinZip
- Encrypting and decrypting a file using PowerCrypt
- Scanning files for viruses using F-Secure Antivirus
- Playing an MP3 file with Winamp
- Playing a WAV file with Winamp
- Playing a DivX video using the DivX codec and Windows Media Player
- Playing a WMV video file using Windows Media Player
- Viewing pictures using Windows Picture Viewer
- Browsing the Internet using Microsoft Internet Explorer
- Loading, playing and exiting a game with Tom Clancy's Ghost Recon
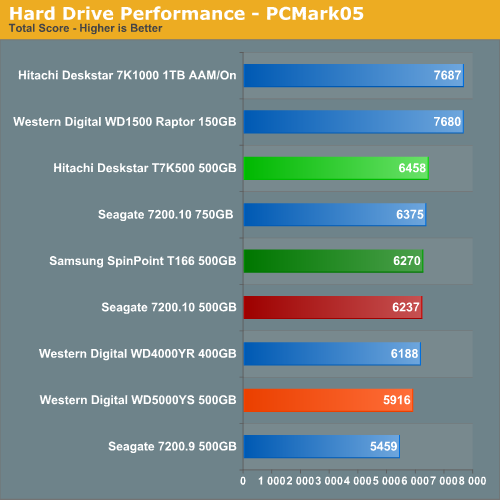
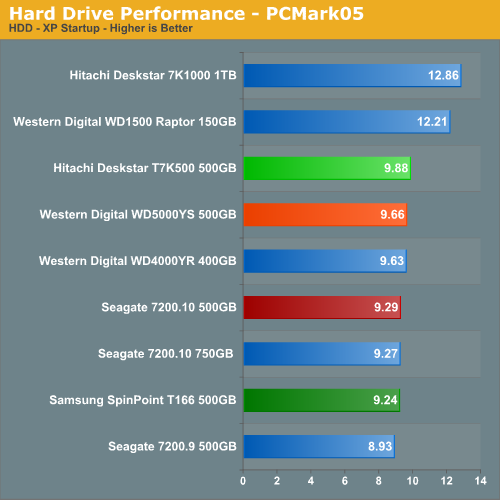
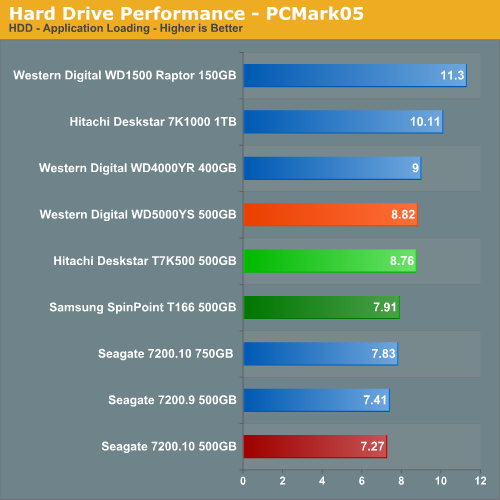
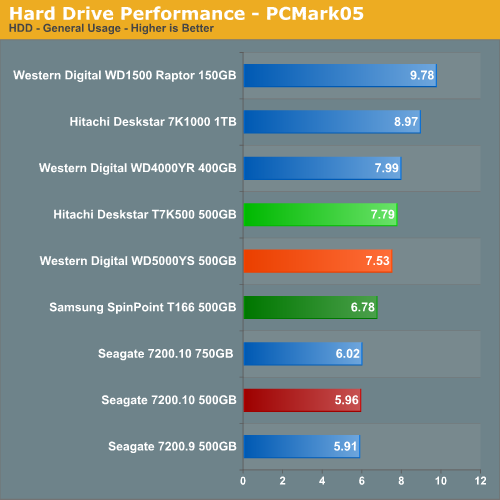
Our PCMark05 numbers indicate the drive is fairly quick but not a speed champion. While not the fastest drive in the stable, it does offer consistent performance and is a better performing drive than the Seagate 7200.10. However, the Hitachi T7K500 is up to 14% faster in the application and general hard disk tests that concentrate on real world applications. In subjective testing, we really did not notice a difference between the two drives.
iPEAK Business Application Tests
Our iPEAK Winstone benchmarks offer a glimpse into how well our hard disk drives will handle general office applications, media encoding, and graphics manipulation. While the business applications that are being tested tend to be more CPU bound, the performance of the hard drive can and will make a difference in the more disk intensive video and graphics applications where large media files are typically being edited.
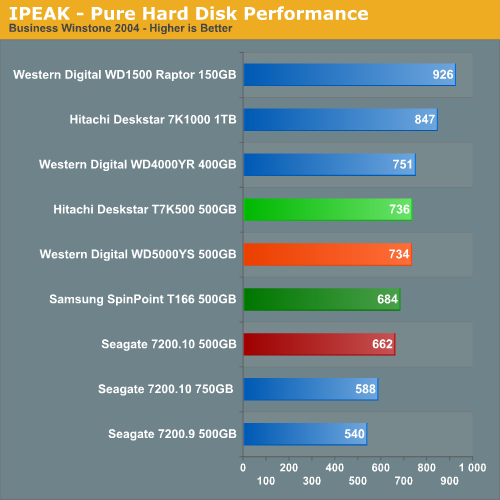
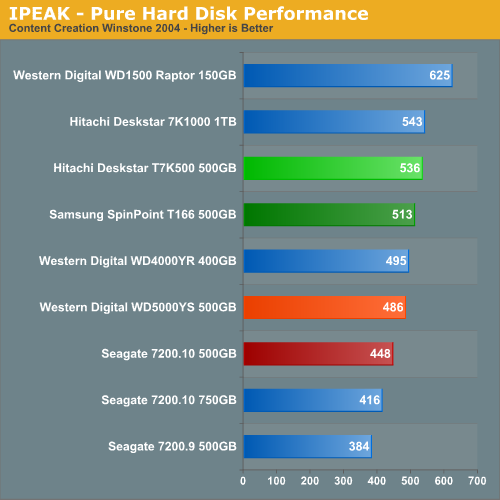
The WD Raptor drives finish at the top in our business application tests as their 10k rpm spindle speed and optimized cache play an important role in their ability to sustain high transfer rates, especially in the Content Creation benchmark where transfer block sizes are significantly larger and more random than in the Business application benchmark. The Samsung 500GB drive is about 7% slower in the Business Winstone and 4% in the Content Creation Winstone than the Hitachi drive but once again places ahead of the Seagate drive.
iPEAK General Task Tests
The iPEAK based General Task benchmarks are designed to replicate utility based tasks that typically are disk intensive and represent common programs utilized on the majority of personal computers. While the WinRAR program is very CPU intensive it will typically stress the storage system in short bursts. Our antivirus benchmark will stress the storage system with continual reads and sporadic write requests while the defragmentation process is split between continual read and write requests.
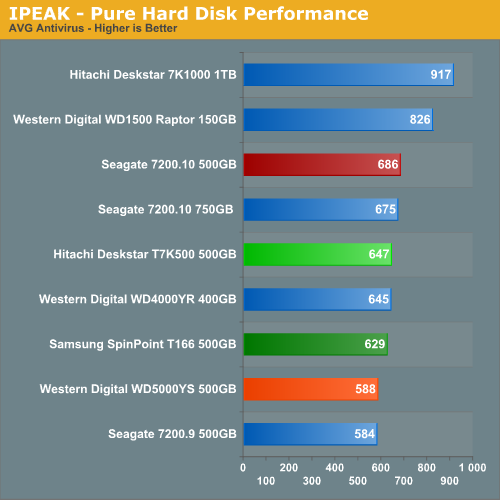
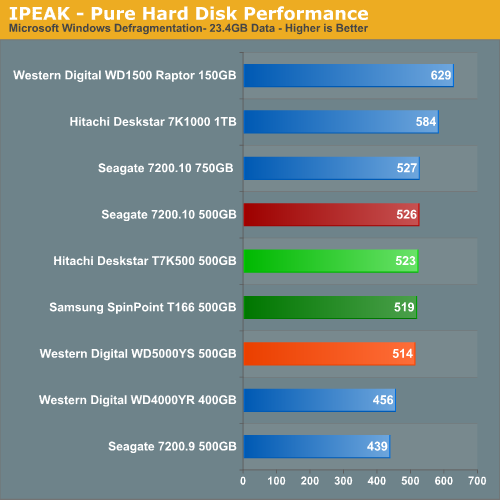
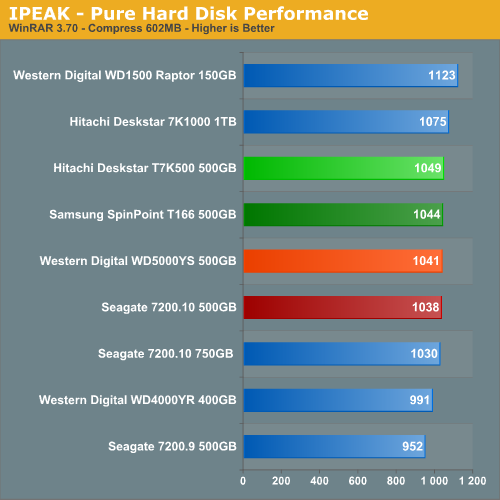
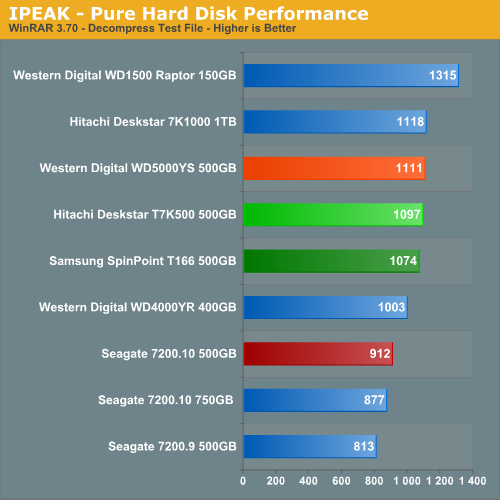
The Samsung drive performs consistently across these four general task benchmarks. While not the fastest 500GB drive in any of the tests, the drive never finishes last. In fact, the SpinPoint's performance is never more than 6% off the pace of the other 500GB drives with an average finish within 2% of the top drive in this storage capacity. Not bad for a drive that costs less than its competitors.
iPEAK Video/Audio Tests
The iPEAK based Video/Audio benchmarks are designed around simulating media encoding and HTPC activities. These are basic benchmarks at this time but this section will be expanded in the future. These benchmarks are CPU intensive in nature but also require a balanced storage system with the ability to handle read and write requests simultaneously in a very efficient manner. Using iPEAK also effectively removes the CPU from the equation, allowing us to focus on the hard drives.
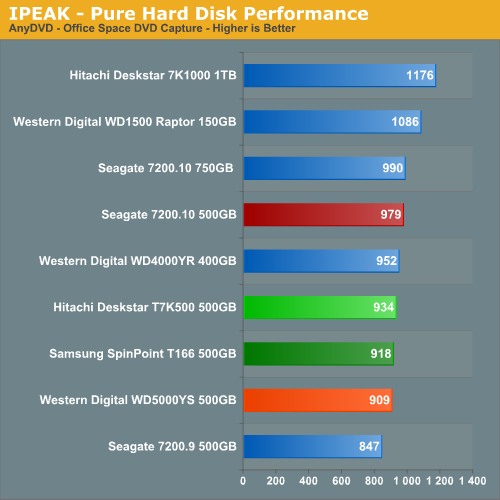
The AnyDVD benchmark is heavily weighted to sequential write requests with the PMR based drives generally finishing ahead of the other 7200rpm drives. The Samsung drive trails the T7K500 by 1% and the Seagate 7200.10 by 7% although these differences are minor.
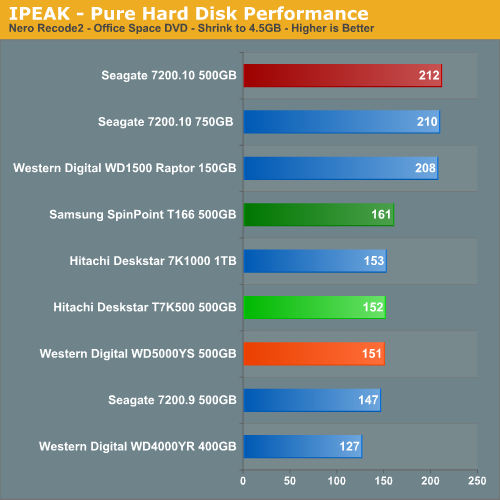
The Nero Recode 2 benchmark is weighted to streaming read requests but is balanced by continuous write operations near the end of the test. This benchmark is one of the most demanding ones in our test suite with the disk being active the entire trace file with several 100% utilization peaks. This benchmark historically favors the Seagate PMR offerings. The Samsung drive finishes ahead of the other 7200rpm drives and outperforms the T7K500 by 6%.
iPEAK Game Installation Tests
Our iPEAK based Game Installation benchmarks simply show the ability of the hard drive to write data as quickly as possible to the disc based upon the installation software instructions. As detailed in our iPEAK setup description we installed the games from our source drive in order to eliminate the optical drive bottleneck. In separate application timing we witnessed basically the same percentage spread when installing the games via our DVD drive so these results are representative of actual installation performance.
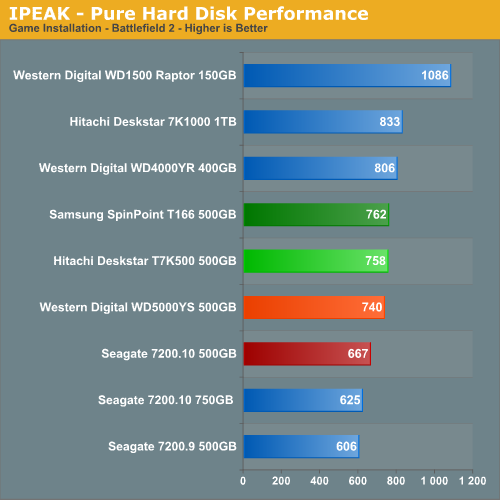
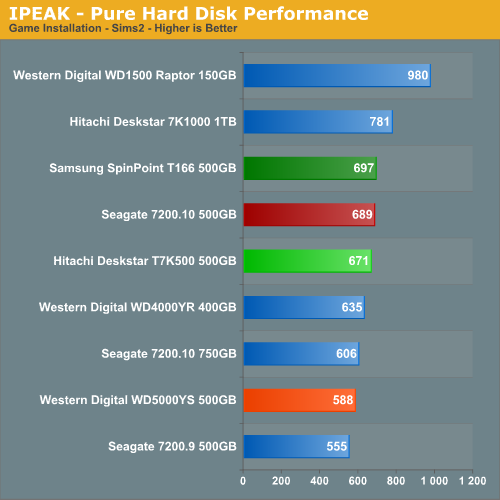
The Raptors once again finish at or near the top in our gaming tests due to their rotational and random access speed advantages. The Samsung SpinPoint T166 takes top honors in the 500GB category by finishing 1% ahead of the Seagate drive in Sims 2 and less than half of a percent ahead of the Hitachi 500GB drive in Battlefield 2. However minor the differences, though, a win is a win.
iPEAK Game Play Tests
The iPEAK based Game Play tests are centered on the benefits of having a hard disk that can load non-linear or sequential data files quickly without interrupting the flow of the game.
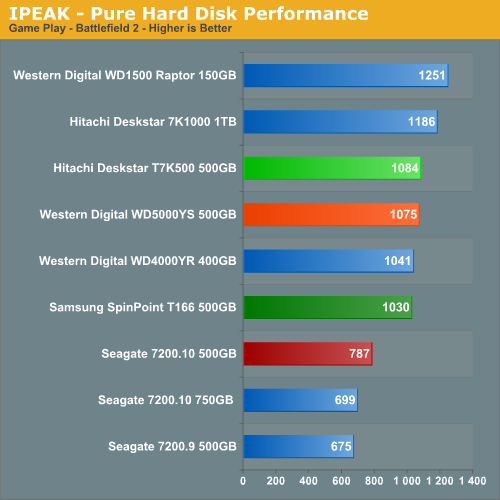
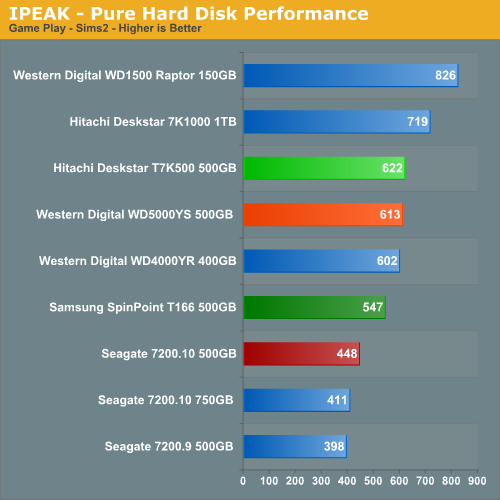
When it comes to game play in our iPEAK tests the Samsung drive falters slightly which surprised us considering the other results. We see the drive being about 5% slower in Battlefield 2 and 13% in Sims 2 when compared to the Hitachi T7K500, although in both benchmarks it finishes ahead of the Seagate 7200.10 500GB drive.
We need to remember our iPEAK tests reflect pure hard drive performance and will be mitigated by the system platform components as we will see in our application tests.
Actual Application Times
Our application benchmarks are designed to show application performance results with times being reported in seconds, with lower scores being better. While these tests will show some differences between the drives it is important to understand we are no longer measuring the pure performance of the hard drive but how well our platform performs with each individual drive. The performance of a hard drive is an integral part of the computer platform but other factors such as memory, CPU, core logic, and even driver choice can play a major role in determining how well the hard drive performs in any given task.
Game Load Test
Our Sims 2: Open for Business test measures the time it takes to load the initial portion of the game. Our application timer starts when the game icon is initiated until the neighborhood menu appears.
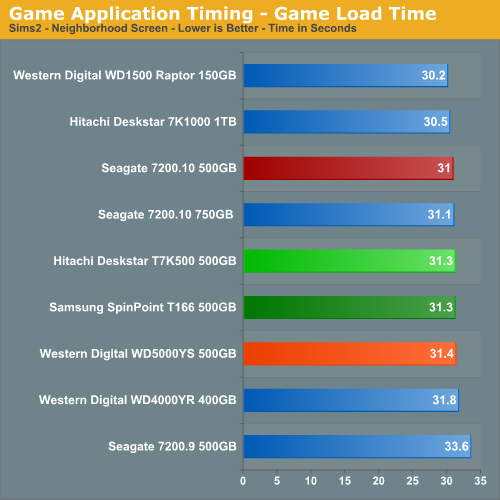
The results are basically the same as our iPEAK results as the WD Raptor series continues to lead all drives; however, the performance differences are not as drastic once we take into account the entire platform. The Samsung drive ties the T7K500 while finishing right behind the Seagate drives and for all intent purposes this tests reveals only minor differences between all of the drives. While the Raptor and Hitachi 1TB drives seemed "snappier" during the game load process, the actual time differences tell another story. Subjectively, during actual game play we thought the Raptor was slightly faster than the other drives but not to the point of giving up the capacity and cost advantages of the 7200rpm drives.
Game Level Load
This test centers on the actual loading of a playable level within our game selections. The Battlefield 2 test measures the time it takes to load the Daqing Oilfields level. Our application timer begins when the start single player icon is initiated and ends when the join game icon is visible.
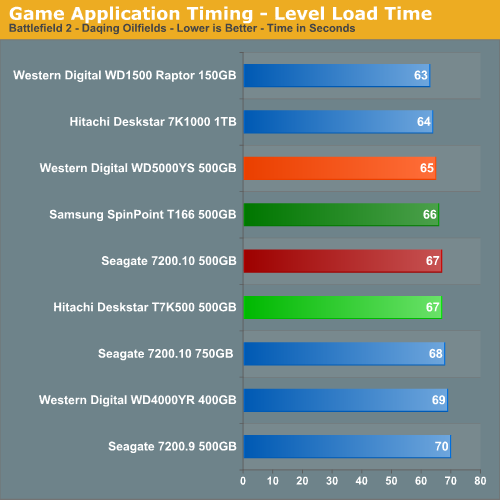
The WD1500ADFD Raptor continues its pattern of being the best available drive for the gaming enthusiast and our subjective opinion also matches the test scores for the most part. That said, the larger capacity advantages of the 7200rpm drives certainly make up for the minimal loss in performance. Our Samsung drive finishes right ahead of the Hitachi and Seagate offerings and mirrors our iPEAK test results.
AnyDVD 6.1
Our next test has us utilizing the "ripping" function of AnyDVD to copy the Office Space DVD file from our source drive to our test drive. Our DVD features 29 files totaling 7.55GB of data and is an excellent test for determining the write speed of a drive.
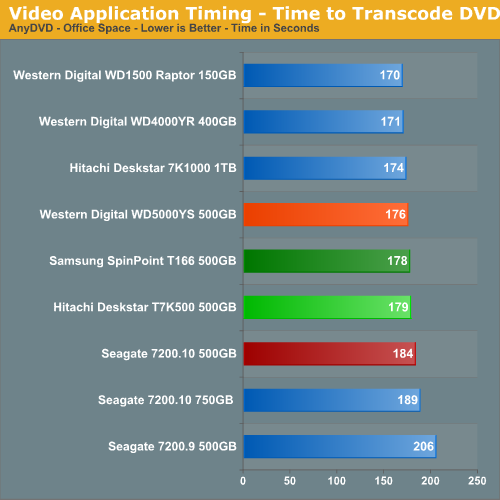
The SpinPoint T166 drive is six seconds faster than the Seagate 7200.10 500GB in this test - a difference of 3%. The Samsung drive also finishes just ahead of the Hitachi drive.
Nero Audio Encode
Our last test has us utilizing the audio encoding functions of Nero to convert our INXS Greatest Hits audio files in MP4 format to a high quality variable rate MP3 file for our portable player. Our test features 16 files totaling 137MB of data and is an excellent test for determining the read and write speed of a drive.
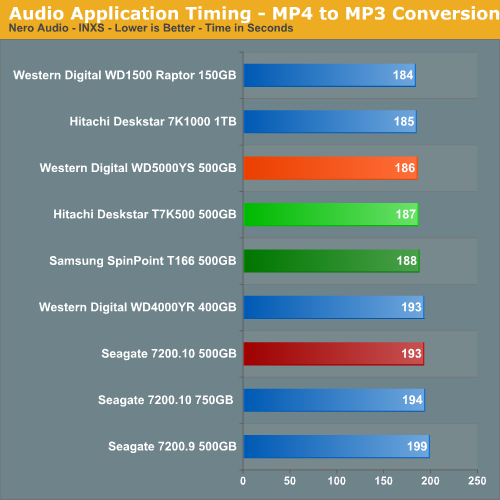
In a slight reversal, we see the Samsung drive finishing a second behind the Hitachi drive but still five seconds ahead of the Seagate 7200.10.
Quick Take
Samsung's SpinPoint T166 delivers excellent performance for the money in our opinion. The overall performance of the drive in the 500GB category remained consistent, and while not always class leading it certainly was not the class dunce. The drive's placement in our actual application tests is always near the top along with very good scores in the iPEAK productivity and general task tests.
While the speed of the drive was at question in our iPEAK game play tests, we really never noticed it during actual game play unless we had just used the Raptor drive as our comparison drive. The true strength of the Samsung SpinPoint T166 500GB drive is its incredible showing in the acoustic and thermal tests while having excellent power consumption numbers and competitive performance.
For all intents and purposes, the drive is whisper quiet - maybe not a perfect soft whisper, but quiet enough that we would not hesitate to use this drive or a combination of drives in an HTPC setup. As a matter of fact, you will see this drive featured prominently in an upcoming article centered on HTPC components and it is our drive of choice to compare against the PVR specific DB35.3 series from Seagate and the CinemaStar 7K500 drives from Hitachi.
Our opinion of the SpinPoint T166 is very high right now and unlike previous Samsung offerings we think this latest series delivers a near perfect combination of performance, quiet operation, thermal management, and price. In terms of pure performance, the Hitachi 500GB drive might be slightly faster, but in practical use it is extremely unlikely anyone would notice the difference in performance. Noise levels on the other hand definitely favor the Samsung T166 drives, and we really see no reason to spend $30 more to get the Hitachi drive. If you are looking for a hard drive in this capacity range then the Samsung HD501LJ should be at the top of your list.


