The Crucial BX200 (480GB & 960GB) SSD Review: Crucial's First TLC NAND SSD
by Billy Tallis on November 3, 2015 9:00 AM ESTATTO - Transfer Size vs Performance
ATTO provides a quick and easy test of performance over a range of block sizes, which makes it a good overview of performance. It usually illustrates quite clearly how performance plateaus as transfer size increases, with reads bumping up against the limits of SATA but writes being limited by the speed of the flash itself.
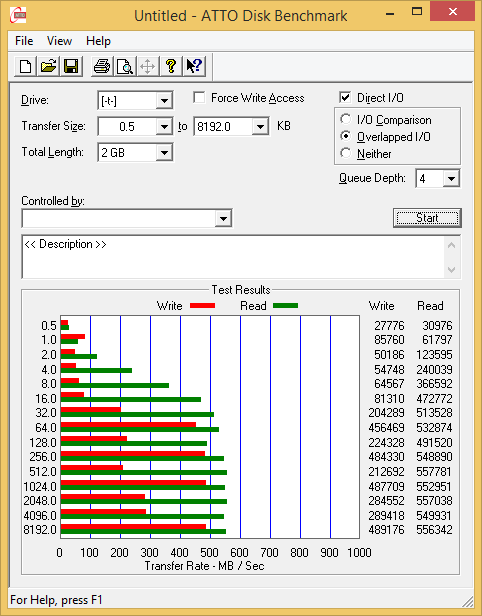
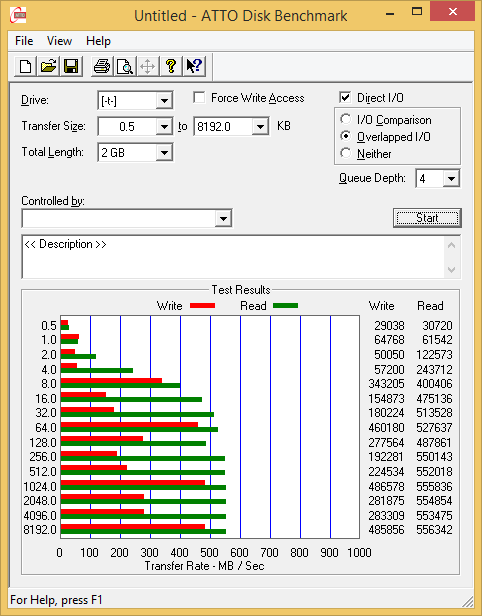
Both capacities of the BX200 produce some of the oddest ATTO plots I've seen. Read performance scales up in a mostly normal fashion, but write performance is all over the place. ATTO alternates between reads and writes, so the drive was not under sustained long-term write pressure but was nevertheless wildly inconsistent. This test is pretty short, but still long enough for the BX200 to run into trouble.
AS-SSD Incompressible Sequential Performance
Drives that perform transparent compression will perform much worse on this test than during the Iometer tests. The SandForce controllers that relied heavily on compression are much less popular (having been largely displaced by controllers from Silicon Motion, Marvell, and Phison), but this in still an important metric to keep in the suite. Many real-world sources of bulk data (such as encoded video) are already heavily compressed and cannot benefit from any attempts at further compression. Like the ATTO test, this is a fairly short test so it is more representative of peak performance than sustained performance.
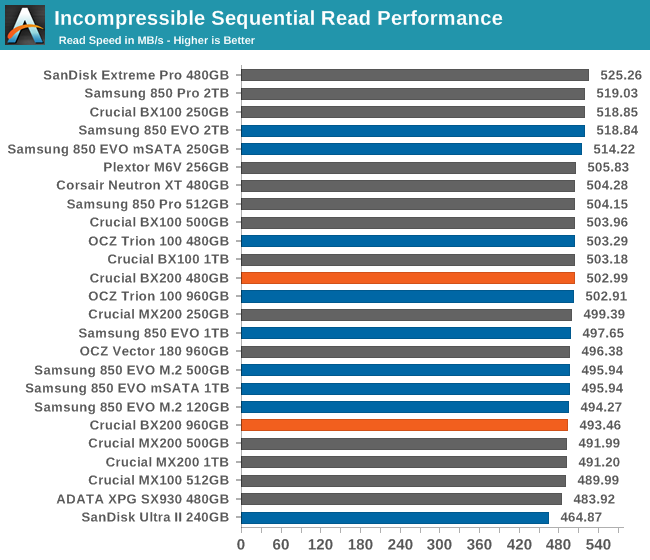
The BX200 had no trouble on the Iometer sequential read test, so it's no surprise that it handles the AS-SSD read test well.
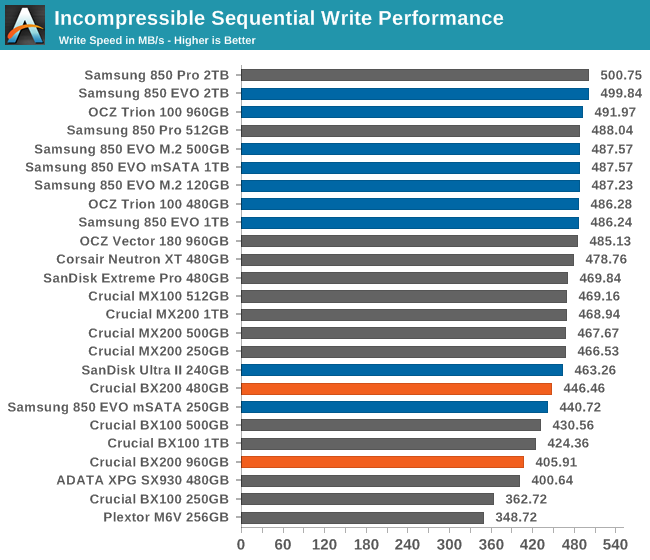
The BX200's write performance on this short test is not great but it is adequate. It's hard to tell whether it suffered a performance crash for a small portion of the test of if this was a case of slow-ish but steady performance and the short duration saved the drive from further embarrassment.


85 Comments
View All Comments
ilkhan - Tuesday, November 3, 2015 - link
If a company is going to shoot for the value proposition, they really need to beat samsung by more than 10%. Paying an extra 10% to get a really solid drive like the 850EVO is just too tempting for anyone who does even the tiniest of research before buying.You either need to be the cheapest, best name brand recognition, or fastest. Crucial isn't any of those on the 250GB market.
AnnonymousCoward - Friday, November 6, 2015 - link
Crucial has better quality and is a U.S. company. You shouldn't give Samung so much credit.squngy - Thursday, November 26, 2015 - link
What does the county of the home office got to do with anything?Samus - Friday, February 19, 2016 - link
Support. Samsungs is a joke. Fortunately the 840 Evo is the only drive they've botched. Crucial has excellent support and an excellent track record to go with their products. Shows good QA. Wouldn't expect anything else from an Intel subsidiary.zeeBomb - Tuesday, November 3, 2015 - link
What's the difference between TLC NAND to MLC or SLC NAND again?Beararam - Tuesday, November 3, 2015 - link
http://www.tomsitpro.com/articles/flash-data-cente...dakishimesan - Tuesday, November 3, 2015 - link
http://www.anandtech.com/show/6337/samsung-ssd-840...coconutboy - Tuesday, November 3, 2015 - link
slc = premium, reliable, fast, expensive, etcmlc = middle ground
tlc = cheap, lowest reliability, but Samsung has gotten tlc quality up to a level sufficient for most non-enterprise users
https://en.m.wikipedia.org/wiki/Multi-level_cell
zeeBomb - Tuesday, November 3, 2015 - link
Okay awesome, thanks.FalcomPSX - Tuesday, November 3, 2015 - link
SLC NAND stores one bit per flash cell. MLC stores two bits per cell. and TLC stores three bits per cell.