Samsung SM951 (512GB) PCIe SSD Review
by Kristian Vättö on February 24, 2015 8:00 AM ESTRandom Read Performance
One of the major changes in our 2015 test suite is the synthetic Iometer tests we run. In the past we used to test just one or two queue depths, but real world workloads always contain a mix of different queue depths as shown by our Storage Bench traces. To get the full scope in performance, I'm now testing various queue depths starting from one and going all the way to up to 32. I'm not testing every single queue depth, but merely how the throughput scales with the queue depth. I'm using exponential scaling, meaning that the tested queue depths increase in powers of two (i.e. 1, 2, 4, 8...).
Read tests are conducted on a full drive because that is the only way to ensure that the results are valid (testing with an empty drive can substantially inflate the results and in reality the data you are reading is always valid rather than full of zeros). Each queue depth is tested for three minutes and there is no idle time between the tests.
I'm also reporting two metrics now. For the bar graph, I've taken the average of QD1, QD2 and QD4 data rates, which are the most relevant queue depths for client workloads. This allows for easy and quick comparison between drives. In addition to the bar graph, I'm including a line graph, which shows the performance scaling across all queue depths. To keep the line graphs readable, each drive has its own graph, which can be selected from the drop-down menu.
I'm also plotting power for SATA drives and will be doing the same for PCIe drives as soon as I have the system set up properly. Our datalogging multimeter logs power consumption every second, so I report the average for every queue depth to see how the power scales with the queue depth and performance.
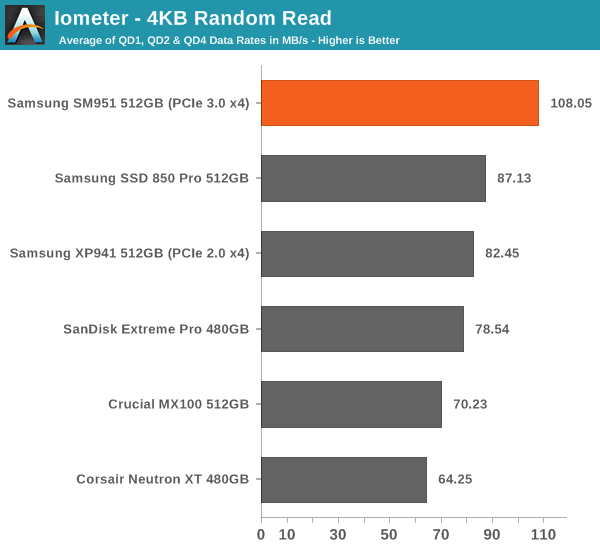
While the other SSDs hover at 60-90MB/s for random reads, the SM951 provides a rather noticeable upgrade at 108MB/s.
 |
|||||||||
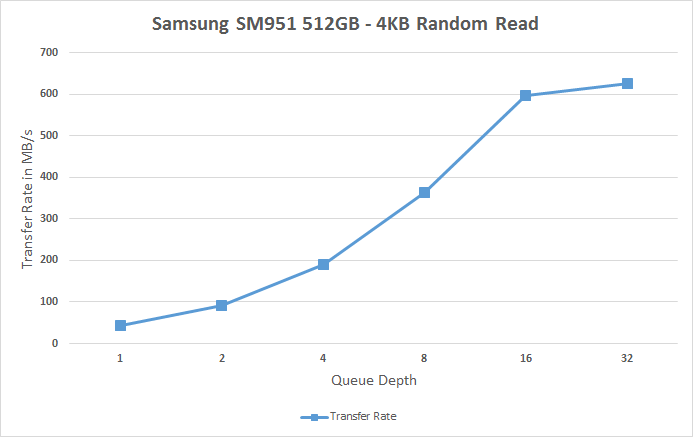
Looking at the performance more closely reveals that the SM951 delivers better performance at all queue depths, although obviously the difference is at high queue depths where the SM951 can take advantage of the faster PCIe interface. The SM951 actually does over 150K IOPS when the MB/s is translated into throughput.
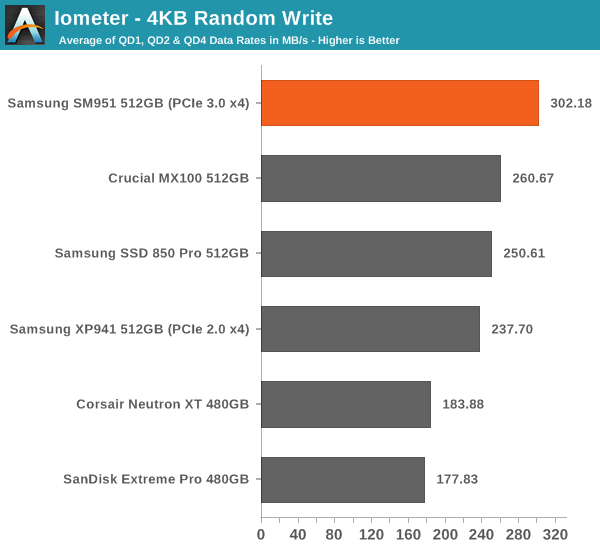
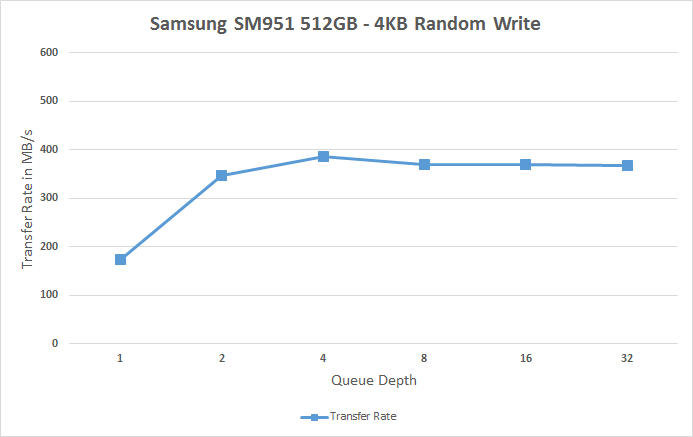
Random write performance is equally strong. The line graphs shows how the SM951 shifts the whole curve up, implying a performance increase at all queue depths. Especially the performance at queue depths of 1 and 2 are noticeably better than on other drives.
 |
|||||||||


128 Comments
View All Comments
Kristian Vättö - Wednesday, February 25, 2015 - link
I didn't test any OCZ drives for this review because the Vector 180 NDA is due in a couple of days, so stay tuned.IlikeSSD - Thursday, February 26, 2015 - link
Vertex 460A is good enough to show the difference (maybe even Arc))Shadowmaster625 - Wednesday, February 25, 2015 - link
You should clip on a simple heatsink and run the tests again.squatsh - Wednesday, February 25, 2015 - link
Based on the orientation of the drive in it's M2 slot. (Ie is the controller facing up or down) Can it be made clear if we could just put a small thermal pad and one of those tiny heatsinks (like you can get for VRMs) on the controller (assuming that is what is overheating) in order to stop the thermal throttling on desktops and laptops with enough space.Luke212 - Wednesday, February 25, 2015 - link
what happened to the Intel P3500? It's been a year and nothing.Mikemk - Wednesday, February 25, 2015 - link
Comment 100Sorry, couldn't resist
awall13 - Thursday, February 26, 2015 - link
Thanks for the great review. I like the changes in how the data is presented. One idea: In the performance consistency section, the steady-state performance could be presented with a single two-color bar per drive, with the full bar representing the average performance, and the shorter bar representing the average - 1 standard deviation. I'd still keep the second chart showing the standard deviation by itself, perhaps. Just a thought.gseguin - Thursday, February 26, 2015 - link
Performance performance performance. Ok, I get it, its fast and hard to find.Since we saw many issues crop up with the predecessors, with eventual fixes by Samsung, how much confidence is there in the drive itself from Anandtech... You know the controllers, you know the memory, you've covered different company's testing methodologies, how much confidence do you have in this product, and why is that absent from the introduction and final thoughts?
Kristian Vättö - Thursday, February 26, 2015 - link
All Samsung's issues have been related to SSD with planar TLC NAND (i.e. 840 & 840 EVO). There is absolutely no reason to believe that the SM951 shares the issues because it's based on MLC NAND and Samsung's MLC NAND based SSDs have been flawless (830 & 840 Pro).kgh00007 - Saturday, February 28, 2015 - link
Hey, nice article. I like the new SSD test suite. Is there any way to add a long term read consistency test, or any sort of read consistency test in light of the Samsung 840 EVO issues?I'm an 840 EVO user with drops in read speed to below 50Mb/s. In fact I have never gotten the advertised 500MB/s read speeds on any SSD I own. Is that because I am using them as the boot drive?
Do you test with the SSD as a second drive in the system? So taking out the overhead of the OS running on the drive as well as the test suite?
Cheers, keep up the good work, I've been learning from this site for a long time....