Corsair Neutron XT (240GB, 480GB & 960GB) SSD Review: Phison S10 Debuts
by Kristian Vättö on November 17, 2014 9:00 AM ESTAnandTech Storage Bench 2013
Our Storage Bench 2013 focuses on worst-case multitasking and IO consistency. Similar to our earlier Storage Benches, the test is still application trace based – we record all IO requests made to a test system and play them back on the drive we are testing and run statistical analysis on the drive's responses. There are 49.8 million IO operations in total with 1583.0GB of reads and 875.6GB of writes. I'm not including the full description of the test for better readability, so make sure to read our Storage Bench 2013 introduction for the full details.
| AnandTech Storage Bench 2013 - The Destroyer | ||
| Workload | Description | Applications Used |
| Photo Sync/Editing | Import images, edit, export | Adobe Photoshop CS6, Adobe Lightroom 4, Dropbox |
| Gaming | Download/install games, play games | Steam, Deus Ex, Skyrim, StarCraft 2, BioShock Infinite |
| Virtualization | Run/manage VM, use general apps inside VM | VirtualBox |
| General Productivity | Browse the web, manage local email, copy files, encrypt/decrypt files, backup system, download content, virus/malware scan | Chrome, IE10, Outlook, Windows 8, AxCrypt, uTorrent, Ad-Aware |
| Video Playback | Copy and watch movies | Windows 8 |
| Application Development | Compile projects, check out code, download code samples | Visual Studio 2012 |
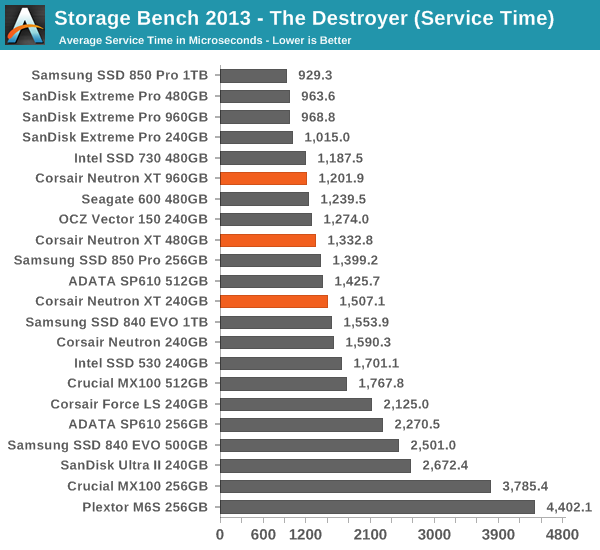
We are reporting two primary metrics with the Destroyer: average data rate in MB/s and average service time in microseconds. The former gives you an idea of the throughput of the drive during the time that it was running the test workload. This can be a very good indication of overall performance. What average data rate doesn't do a good job of is taking into account response time of very bursty (read: high queue depth) IO. By reporting average service time we heavily weigh latency for queued IOs. You'll note that this is a metric we have been reporting in our enterprise benchmarks for a while now. With the client tests maturing, the time was right for a little convergence.
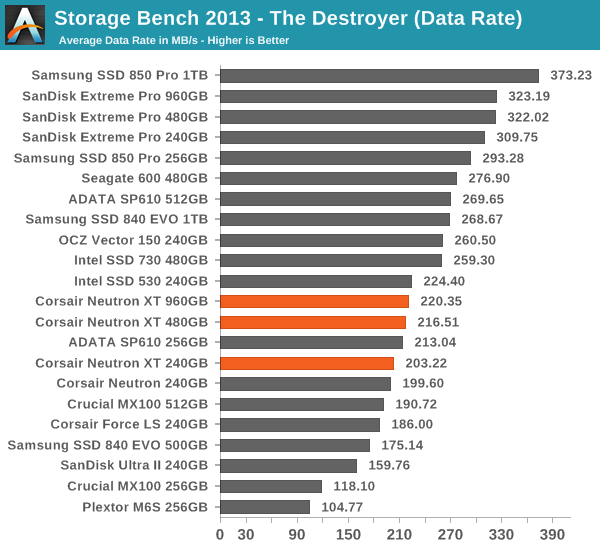
The Neutron XT offers a healthy performance boost over the Force LS in our 2013 Storage Bench, but overall ends up in the middle-class. The Phison S10 platform appears to be very competitive with Silicon Motion's SM2246EN (ADATA SP610 in the graphs), but it can't challenge the high-end drives from Samsung, SanDisk, and OCZ.


56 Comments
View All Comments
hojnikb - Tuesday, November 18, 2014 - link
So pretty much, we're gonna have to wait another year or so to get 3D nand products (ie. mx200).Chrispy_ - Tuesday, November 18, 2014 - link
Corsair *knows* you're going to test steady state.If the drive isn't good at steady state, why risk mass exposure with a bad review when a simple firmware update could make a big difference?
First impressions matter, and the Neutron XT is now an underwhelming drive unlikely to be able to compete with the MX100s on price.
ol1bit - Wednesday, November 19, 2014 - link
I'm on my 3rd SSD.1st was Intel 74GB (first one would lock up, got Intel to replace it then was good).
2nd was Corsair Force Series GT CSSD-F120GBGT-BK, and if my system got to busy, SSD would lock up HD light on solid, hard reset required, tried new drivers, everything and honestly I gave up on this drive, never fixed.
3rd is Samsung 840 pro 250GB Uber fast, no lockups ever. I'm sticking with them for the foreseeable future!
zmeul - Wednesday, November 19, 2014 - link
any word on pricing?dj christian - Thursday, November 20, 2014 - link
On the Performance Consistency page."Each of the three graphs has its own purpose. The first one is of the whole duration of the test in log scale. The second and third one zoom into the beginning of steady-state operation (t=1400s) but on different scales: the second one uses log scale for easy comparison whereas the third one uses linear scale for better visualization of differences between drives. Click the dropdown selections below each graph to switch the source data."
Which third one? All show log data and the last one doesn't show linear data.
editorsorgtfo - Saturday, November 22, 2014 - link
My A10-7850K / G.1 Sniper A88X build-in-progress is perfect for an M.2 (NGFF) SSD on a PCIe 2.0 x4 adapter card. The mobo's single PCIe 3.0 x16 slot is ripe for a Radeon R7 250, for Dual Graphics use, and its other x16 slot is PCIe 2.0, running at x4, ready for a bootable SSD to be installed.As for adapters, a Bplus M2P4A, a Lycom DT-120, or a (not-yet-released) ASUS Hyper M.2 X4 would fit the bill nicely.
The LSI SandForce SF3739-controlled cards, such as the ADATA that was shown at Computex 2013 and the Kingston seen at Storage Visions 2014 back in January, or the Kingston HyperX using the Marvell 88SS9293 Altaplus PCIe 2.0 x4 SSD Controller displayed at Computex 2014, or Phison's, or Hynix's controller-in-the-works, etc. have yet to be released to the retail market. Don't they know the world's enthusiasts are just itching to spend their dosh on those gems?!
Kingston trotted out their native PCIe expansion-slot HyperX "Predator" unit at the 2014 CES show in January, with a SF3739 controller. That's actually the unit I want! So, it's "hurry up and wait" at my house! LOL