The Apple iPad Air 2 Review
by Joshua Ho on November 7, 2014 9:30 AM EST- Posted in
- Tablets
- Apple
- Mobile
- iOS
- ipad Air 2
Battery Life
With the move from featurephones to smartphones, battery life has been and continues to be a critical issue. While it wasn’t unusual to see a week or more of battery life on a featurephone, some of the earliest smartphones couldn’t even last a day. While tablets seem to have a much easier time achieving high levels of battery life by virtue of massively increased volume, they still face similar issues as they are often used for gaming or other more intensive workloads that a smartphone is unlikely to see nearly as often. In order to test this, we run our tablets through a standard suite of tests of various use cases. In all cases where the display is on, all displays are calibrated to a brightness of 200 nits to draw useful relative comparisons.
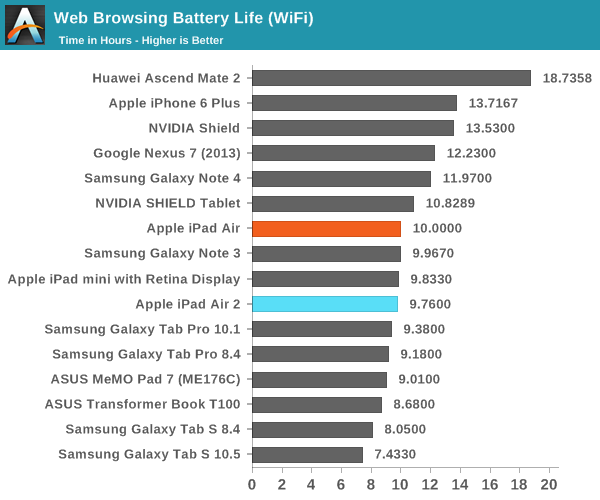
In our first test, we see that the iPad Air 2 is about roughly equivalent to the original iPad Air for WiFi web browsing. This is actually a bit surprising as the battery in the iPad Air 2 is approximately 84% of the iPad Air. This would mean that we would expect the iPad Air 2 to get around 8.4 hours of battery life in this test, which represents a 16% gain to efficiency. It’s likely that these improvements to battery life come from the new process node on the A8X, along with the newer WiFi module.
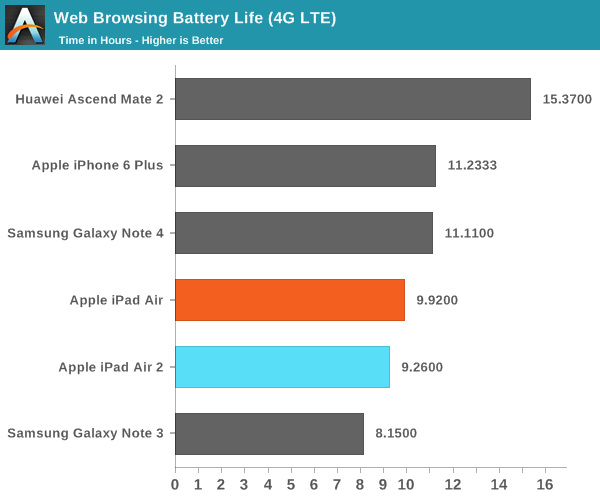
Along the same lines, the LTE web browsing test tracks quite closely but it seems that there’s a minor decrease in efficiency gains when compared to WiFi. This difference is likely to be explained by the much higher bandwidth available in WiFi when compared to LTE.
While the web browsing tests are effective at ensuring faster SoCs aren’t punished, this inherently tilts battery life towards a more display-bound mode rather than compute-bound. Unfortunately short of a jailbreak it doesn’t seem possible to get an effective Basemark OS II battery test, so we’re mostly limited to a test of GFXBench’s unlimited rundown.
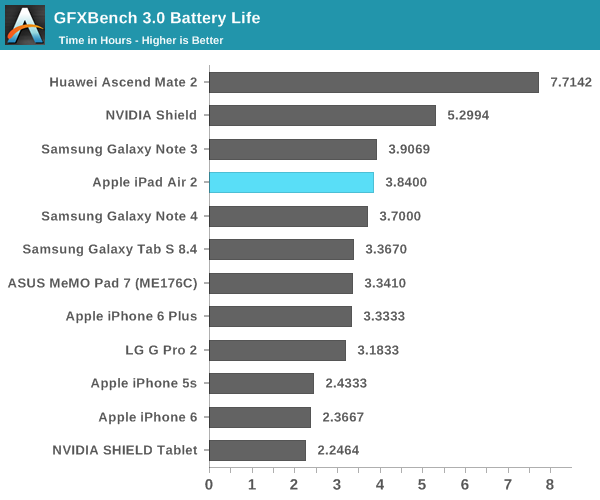
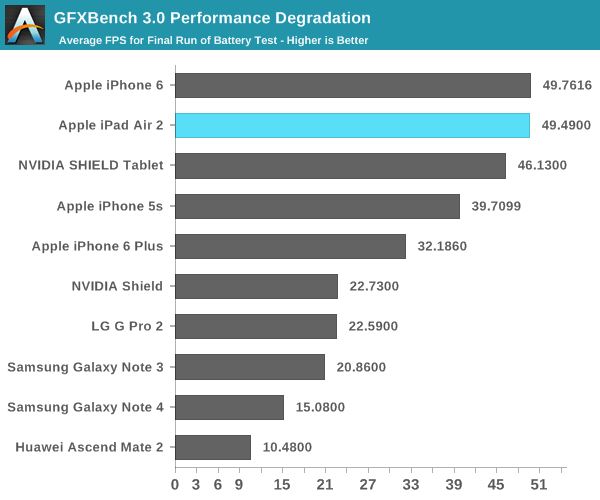
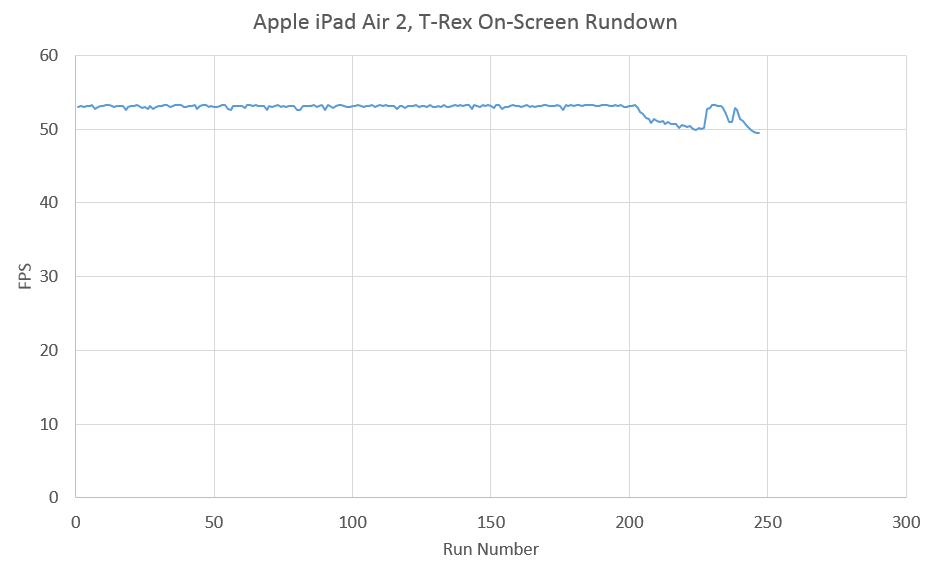
As one can see, the iPad Air 2 is one of the best performers on this test, considering its frame rate and runtime. While NVIDIA's GK20A GPU in Tegra K1 can get close to the GX6650 for short periods of time, over a long workload it's pretty clear that the GX6650 on 20nm has better sustained performance and significantly superior efficiency as it doesn't throttle until the 200th iteration of the test. It's important to note that the iPad Air 2 is running at a higher native resolution here, so relative to SHIELD Tablet a scaling factor needs to be estimated in order to get an idea for performance at the same resolution. During this test I saw that the skin temperatures never exceeded 45C, so this isn't the result of Apple choosing to run the device hotter than most.
Charge Time
While tablets deliver some great battery life in general, charge time tends to be much slower than that of smartphones as the battery is much larger and charging the device isn't as time critical due to the longer battery life . While we can't quite cover the full range of battery life uses cases, it's important to remember that in cases where the platform is otherwise identical beyond display that battery life scales linearly with overall capacity. In order to test charge time, we measure the time it takes for the battery to reach 100% from a fully-depleted state.
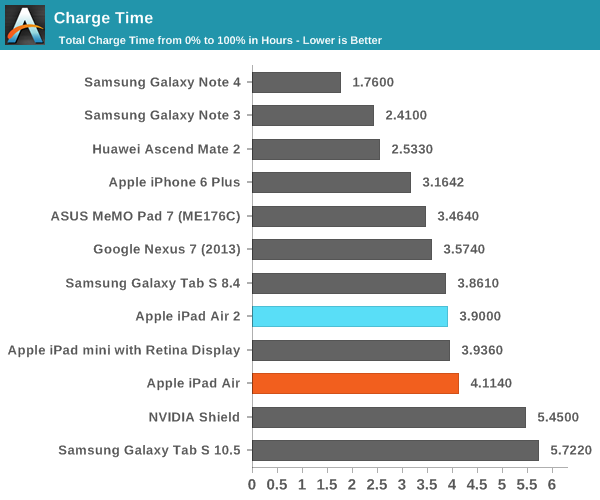
As one can see, the smaller battery seems to have a noticeable impact on charge time, although the difference isn't really all that notable as the difference is only around ten minutes at the end of the day.


226 Comments
View All Comments
tipoo - Friday, November 7, 2014 - link
Question, don't you have to divide the final FPS of the performance degradation test with the first run, to see how much it actually went down? Otherwise you're not looking at degradation so much as total performance still. Performance may have degraded, but if it's higher to start with it's probably still higher in the end relatively.tipoo - Friday, November 7, 2014 - link
ie, if one device starts with 100FPS and degrades 40%, and the other starts at 50 and degrades 10%, the degradation on the second one is lower but the first one will still show higher on that graph.JoshHo - Friday, November 7, 2014 - link
This is definitely true, and it's taken into account when writing the review. In this case the degradation wasn't large enough to change any conclusions on the matter.kenansadhu - Friday, November 7, 2014 - link
That NVIDIA Shield tablet is looking more and more interesting for me. I hope it will get a discount this holiday seasonphoenix_rizzen - Friday, November 7, 2014 - link
Yeah, it certainly is. This looks like the proper upgrade for a 2012 Nexus 7 running Tegra3.lucam - Friday, November 7, 2014 - link
What's up to Tegra 4..:)chizow - Friday, November 7, 2014 - link
Any plans to update these graphs with Nexus 9 results? Sorry if this is mentioned in the piece somewhere, I tend to skip around before sitting down to read them in their entirety, thanks!tipoo - Friday, November 7, 2014 - link
They waited for the newer firmware on the Nexus 9 before finalizing results I believe.coldpower27 - Friday, November 7, 2014 - link
"The fact that Apple used A7 in the previous iPad Air means that on top of already being a serious step up in transistor count versus A8, compared to the iPad Air 1 the gap is even larger. A7 occupied 102mm2 and more than 1 billion transistors, so compared to Apple’s previous tablet Apple has come very close to doubling their transistor count within 1 generation. "Did you mean triple? As 3 Billion is well over doubling of 1 Billion.
Ryan Smith - Friday, November 7, 2014 - link
Doubling is correct. A7 is over 1B. I suspect it's close to 1.5B.