The Intel Haswell Refresh Review: Core i7-4790, i5-4690 and i3-4360 Tested
by Ian Cutress on May 11, 2014 3:01 AM ESTFor our discrete GPU benchmarks, we have split them up into the different GPU configurations we have tested. We have access to both MSI GTX 770 Lightning GPUs and ASUS reference HD 7970s, for SLI and Crossfire respectively. These tests are all run at 1080p and maximum settings, reporting the average and minimum frame rates.
dGPU Benchmarks: 1x ASUS HD7970
F1 2013
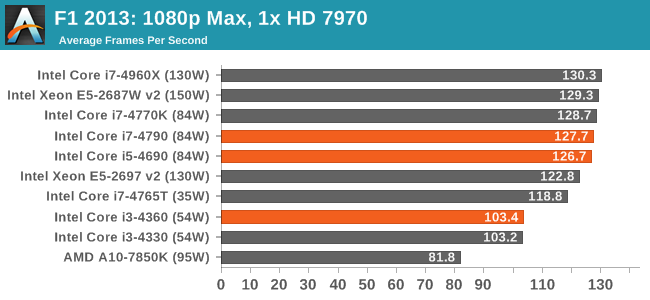
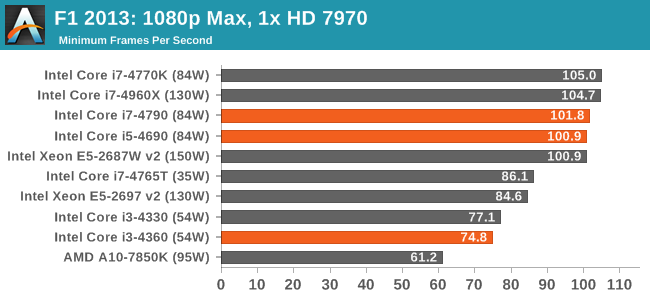
With a single 7970, the 25% minimum frame-rate difference between an i3 and an i5 is almost astonishing.
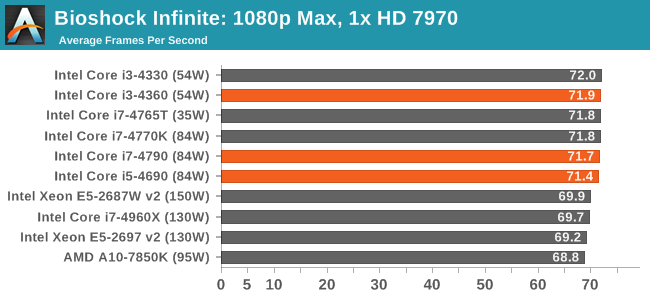
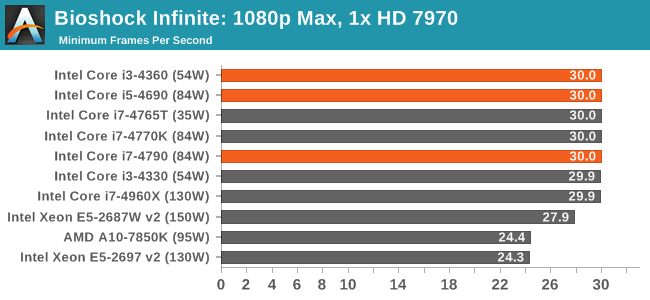
Bioshock Infinite
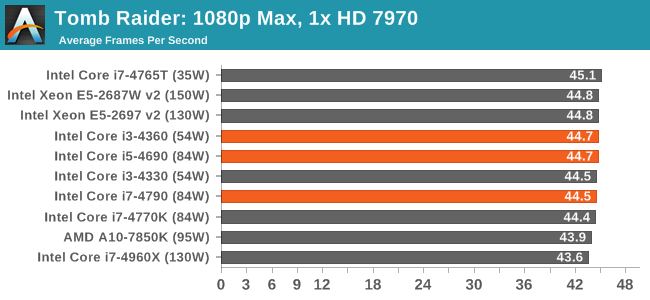
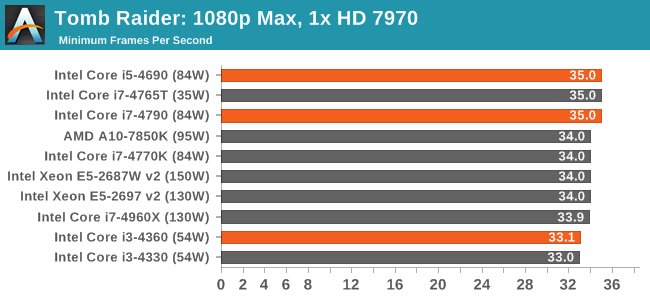
Tomb Raider
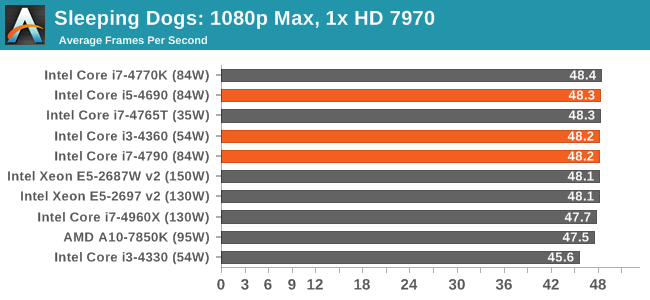
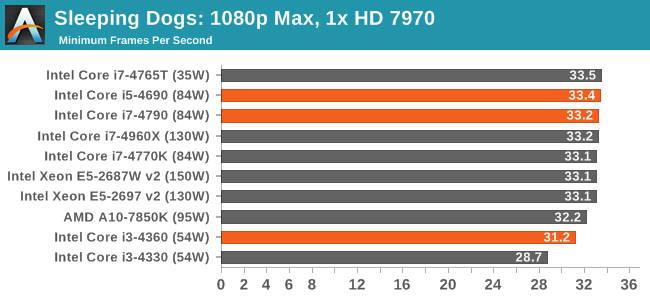
Sleeping Dogs
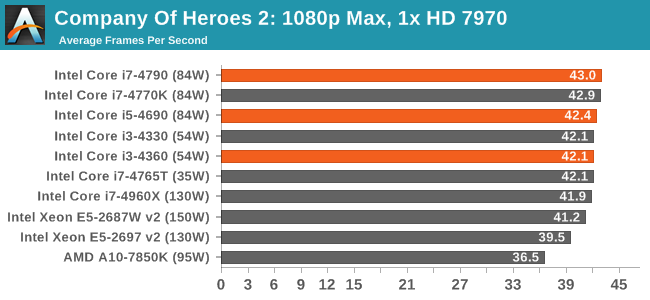
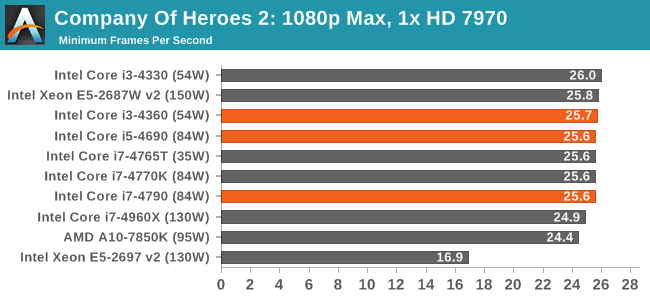
Company of Heroes 2
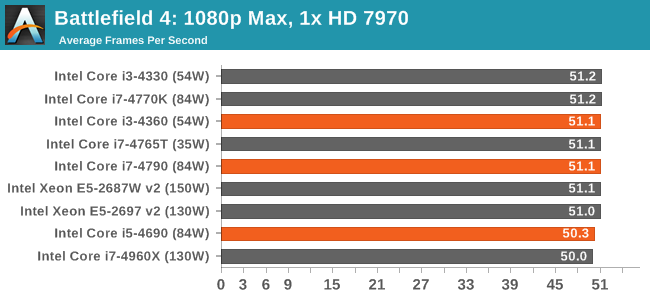
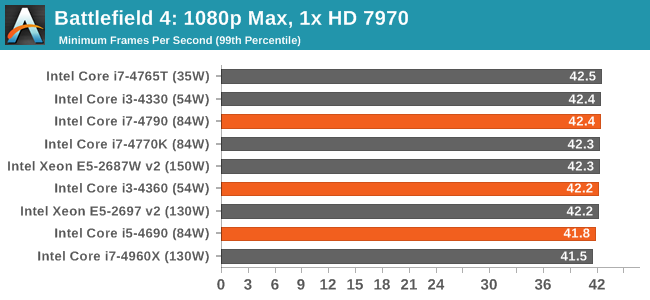
Battlefield 4
Analysis
Aside from F1 2013, using a single HD7970 does not seem to affect frame rates so much at 1080p with all the eye candy turned on.


130 Comments
View All Comments
roxamis - Monday, May 12, 2014 - link
Take the measurement as qualitative not quantitive.Power consumption at the wall doesn't mean much as a number. Its wrong on many levels, only one of which is the PSU efficiency. It doesn't really matter what % is the load, you measure one thing and you try to deduce something else
Wall plug wattmeters can't measure PSUs correclty anyway. Take these numbers with a grain of salt.
MrSpadge - Monday, May 12, 2014 - link
The way it is done now fold the power efficiency curve of the PSU (which is rather steep at low loads) with the actual differences between components (which is what we actually want to measure). Noting that the method in general is not very precise doesn't change this.And since power consumption is not plotted for the multi-GPU setups (and doesn't need to, for such an article) it's not necessary to keep the PSU similar across all configurations. I'd rather have a flat PSU curve for all CPUs - this way I could better judge the differences between them.
rajod1 - Friday, May 30, 2014 - link
Wall power readings do mean something to some people just not you.wpcoe - Sunday, May 11, 2014 - link
The chart comparing the three new Haswell Refresh CPUs with the three previous counterparts shows the i3-4330 as 3500 base frequency, but all the benchmarks following a bit later show the i3-4330 as 3.6Ghz. The ark.intel.com page shows the i3-4330 to be 3.5Ghz, so I think maybe the benchmarks have an incorrect speed?Ian Cutress - Sunday, May 11, 2014 - link
It was just those power test graphs that had it mistyped, my bad. Review updated, 3.5 GHz is the correct frequency.The0ne - Sunday, May 11, 2014 - link
The separation of desktop and workstation hasn't changed. It is technology that has changed and allowed for smaller, faster, quieter, more energy efficient hardware to be use. I felt it was unnecessary to give labels to something such as this. Human-Limiting?bji - Sunday, May 11, 2014 - link
"Human limited" vs "CPU limited" is a much, much clearer way of saying what the author is trying to say than is an artificial definition of "workstation" vs. "desktop" that you are proposing.Flunk - Monday, May 12, 2014 - link
Splitting workstation and desktop has always been about fleecing more money out of people for top end systems. There really isn't a practical difference.Smile286 - Sunday, May 11, 2014 - link
What about temperatures? Are those Haswell Refresh processors less hotter or not?Laststop311 - Sunday, May 11, 2014 - link
Well this was a pointless waste of time. We already know how Haswell performs. Should of just copy pasted the specs and linked back to previous haswell reviews. The only interesting thing, the devil's canyon with better TIM, was the only thing not covered.What people want to see is a bunch of DC OC attempts from various sites to see the average max oc and max temp it has and compare that to the 4770k. Everything else in this refresh is meaningless as we have already seen haswell benchmarked. Grats wasting your time, at least u got paid.