OCZ Vertex 460 (240GB) Review
by Kristian Vättö on January 22, 2014 9:00 AM EST- Posted in
- Storage
- SSDs
- OCZ
- Indilinx
- Vertex 460
AnandTech Storage Bench 2013
When Anand built the AnandTech Heavy and Light Storage Bench suites in 2011 he did so because we did not have any good tools at the time that would begin to stress a drive's garbage collection routines. Once all blocks have a sufficient number of used pages, all further writes will inevitably trigger some sort of garbage collection/block recycling algorithm. Our Heavy 2011 test in particular was designed to do just this. By hitting the test SSD with a large enough and write intensive enough workload, we could ensure that some amount of GC would happen.
There were a couple of issues with our 2011 tests that we've been wanting to rectify however. First off, all of our 2011 tests were built using Windows 7 x64 pre-SP1, which meant there were potentially some 4K alignment issues that wouldn't exist had we built the trace on a system with SP1. This didn't really impact most SSDs but it proved to be a problem with some hard drives. Secondly, and more recently, we've shifted focus from simply triggering GC routines to really looking at worst-case scenario performance after prolonged random IO.
For years we'd felt the negative impacts of inconsistent IO performance with all SSDs, but until the S3700 showed up we didn't think to actually measure and visualize IO consistency. The problem with our IO consistency tests is that they are very focused on 4KB random writes at high queue depths and full LBA spans–not exactly a real world client usage model. The aspects of SSD architecture that those tests stress however are very important, and none of our existing tests were doing a good job of quantifying that.
We needed an updated heavy test, one that dealt with an even larger set of data and one that somehow incorporated IO consistency into its metrics. We think we have that test. The new benchmark doesn't even have a name, we've just been calling it The Destroyer (although AnandTech Storage Bench 2013 is likely a better fit for PR reasons).
Everything about this new test is bigger and better. The test platform moves to Windows 8 Pro x64. The workload is far more realistic. Just as before, this is an application trace based test–we record all IO requests made to a test system, then play them back on the drive we're measuring and run statistical analysis on the drive's responses.
Imitating most modern benchmarks Anand crafted the Destroyer out of a series of scenarios. For this benchmark we focused heavily on Photo editing, Gaming, Virtualization, General Productivity, Video Playback and Application Development. Rough descriptions of the various scenarios are in the table below:
| AnandTech Storage Bench 2013 Preview - The Destroyer | ||||||||||||
| Workload | Description | Applications Used | ||||||||||
| Photo Sync/Editing | Import images, edit, export | Adobe Photoshop CS6, Adobe Lightroom 4, Dropbox | ||||||||||
| Gaming | Download/install games, play games | Steam, Deus Ex, Skyrim, Starcraft 2, BioShock Infinite | ||||||||||
| Virtualization | Run/manage VM, use general apps inside VM | VirtualBox | ||||||||||
| General Productivity | Browse the web, manage local email, copy files, encrypt/decrypt files, backup system, download content, virus/malware scan | Chrome, IE10, Outlook, Windows 8, AxCrypt, uTorrent, AdAware | ||||||||||
| Video Playback | Copy and watch movies | Windows 8 | ||||||||||
| Application Development | Compile projects, check out code, download code samples | Visual Studio 2012 | ||||||||||
While some tasks remained independent, many were stitched together (e.g. system backups would take place while other scenarios were taking place). The overall stats give some justification to what we've been calling this test internally:
| AnandTech Storage Bench 2013 Preview - The Destroyer, Specs | |||||||||||||
| The Destroyer (2013) | Heavy 2011 | ||||||||||||
| Reads | 38.83 million | 2.17 million | |||||||||||
| Writes | 10.98 million | 1.78 million | |||||||||||
| Total IO Operations | 49.8 million | 3.99 million | |||||||||||
| Total GB Read | 1583.02 GB | 48.63 GB | |||||||||||
| Total GB Written | 875.62 GB | 106.32 GB | |||||||||||
| Average Queue Depth | ~5.5 | ~4.6 | |||||||||||
| Focus | Worst-case multitasking, IO consistency | Peak IO, basic GC routines | |||||||||||
SSDs have grown in their performance abilities over the years, so we wanted a new test that could really push high queue depths at times. The average queue depth is still realistic for a client workload, but the Destroyer has some very demanding peaks. When we first introduced the Heavy 2011 test, some drives would take multiple hours to complete it; today most high performance SSDs can finish the test in under 90 minutes. The Destroyer? So far the fastest we've seen it go is 10 hours. Most high performance SSDs we've tested seem to need around 12–13 hours per run, with mainstream drives taking closer to 24 hours. The read/write balance is also a lot more realistic than in the Heavy 2011 test. Back in 2011 we just needed something that had a ton of writes so we could start separating the good from the bad. Now that the drives have matured, we felt a test that was a bit more balanced would be a better idea.
Despite the balance recalibration, there is just a ton of data moving around in this test. Ultimately the sheer volume of data here and the fact that there's a good amount of random IO courtesy of all of the multitasking (e.g. background VM work, background photo exports/syncs, etc...) makes the Destroyer do a far better job of giving credit for performance consistency than the old Heavy 2011 test. Both tests are valid; they just stress/showcase different things. As the days of begging for better random IO performance and basic GC intelligence are over, we wanted a test that would give us a bit more of what we're interested in these days. As Anand mentioned in the S3700 review, having good worst-case IO performance and consistency matters just as much to client users as it does to enterprise users.
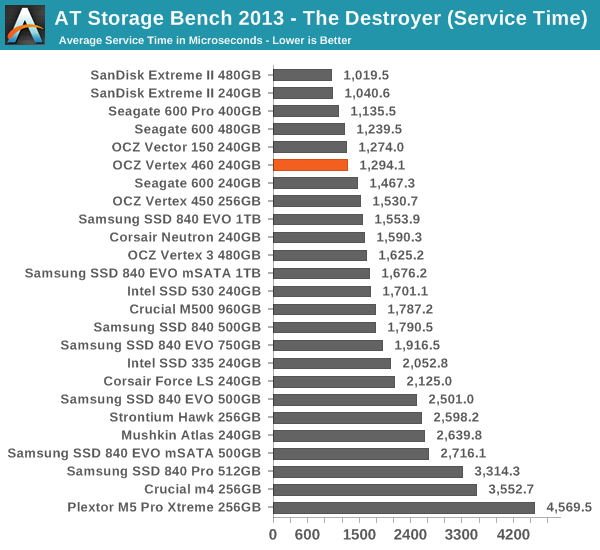
We are reporting two primary metrics with the Destroyer: average data rate in MB/s and average service time in microseconds. The former gives you an idea of the throughput of the drive during the time that it was running the Destroyer workload. This can be a very good indication of overall performance. What average data rate doesn't do a good job of is taking into account response time of very bursty (read: high queue depth) IO. By reporting average service time we heavily weigh latency for queued IOs. You'll note that this is a metric we've been reporting in our enterprise benchmarks for a while now. With the client tests maturing, the time was right for a little convergence.
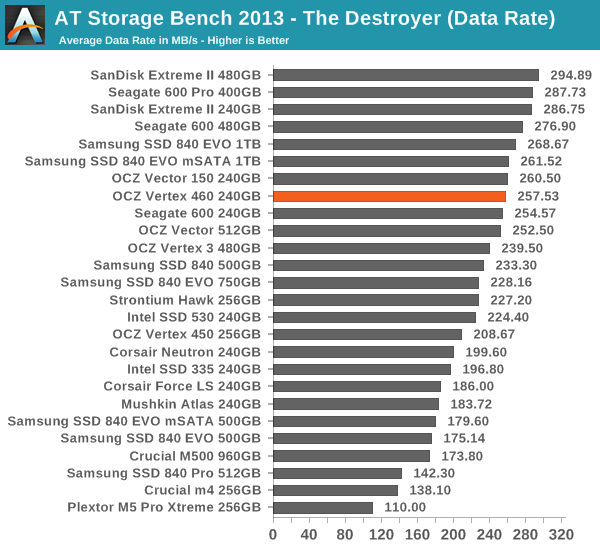
The Vertex 460 is only a hair slower than the Vector 150 in our Storage Bench 2013. The difference actually falls into the margin of error, so it seems that in spite of the lower clock speed, the performance is essentially the same.


69 Comments
View All Comments
dgingeri - Wednesday, January 22, 2014 - link
This thing has the same problem as my Vertex 4 drives. I'm not impressed. It essentially means that half the capacity is unusable due to the way the controller works.Guspaz - Wednesday, January 22, 2014 - link
Hrrm. Getting merged into Toshiba's SSD group is about the only thing that might have tempered my "never again" position on OCZ. By keeping them independent, they're doing nothing to convince me that they're going to change their ways. It's their own questionable decisions that got them into this mess (their reputation for poor reliability), sacrificing reliability at the alter of performance and shipping first.dgingeri - Wednesday, January 22, 2014 - link
You think the Toshiba name is good reliability? I have 224 enterprise hard drives that would say differently. Four years ago, I got 204 Fujitsu/Toshiba (just after Toshiba took over) 146GB 15k SAS drives. Over the course of the first three years, I replaced 165 of them, plus 19 of the replacements that came in as Toshiba branded drives with the same model number. After the warranty ended, I have had to replace the remaining ones by purchasing new ones. None of them are left now. All have been replaced with Seagate Saavios of the same size. They are worse than any desktop level hard drives I have dealt with in my career. I've only had one incident like it, and that was replacing Dell Optiplex motherboards with embedded TNT2-m64 chips back in 2000.Guspaz - Wednesday, January 22, 2014 - link
Seagate has rather questionable reliability themselves (see BackBlaze's recent study on this), but Toshiba's hard disk division is unrelated to their SSD division, so the reliability of one doesn't necessarily give any indication about the reliability of the other.dgingeri - Wednesday, January 22, 2014 - link
In the 2.5" enterprise hard drive market, Seagate has been top of the heap for a long time. They really do well in that arena. There aren't a whole lot of players in that arena, though. Only Seagate, Toshiba (formerly Fujitsu,) and Hitachi. Seagate's Saavio line happens to be the first line ever in 2.5" 10k or 15k drives.As far as desktop drives go, Seagate's desktop drives have had reliability problems for years, sure, but they aren't near as bad as Toshiba's desktop drives.
Dahak - Wednesday, January 22, 2014 - link
Wonder if ocz will use/can use toshiba's ssd team for addition support(firmware/validation)even though they are separate entitiesAlso found it funny that while reading this review I had ads for Crucial's SSD :)
MrSpadge - Wednesday, January 22, 2014 - link
Otherwise the aquisition wouldn't make much sense, would it? Keep them somewhat separate but use any synergetic benefits.Dahak - Wednesday, January 22, 2014 - link
I would think so too but the way it is worded in the article seems like they wontpiroroadkill - Wednesday, January 22, 2014 - link
Why don't you just review a rock or a potato? Because I doubt many people want to purchase OCZ products.toyotabedzrock - Wednesday, January 22, 2014 - link
It might be a good idea to not copy and paste the same explanation of the tests in every article.Just link to the information. It is just headache inducing that I have hunt for relevant information interleaved with the copy and pasted parts.