OCZ Vertex 460 (240GB) Review
by Kristian Vättö on January 22, 2014 9:00 AM EST- Posted in
- Storage
- SSDs
- OCZ
- Indilinx
- Vertex 460
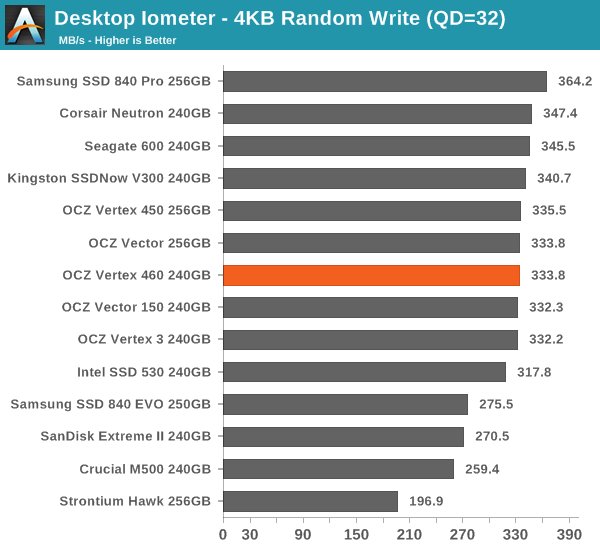
Random Read/Write Speed
The four corners of SSD performance are as follows: random read, random write, sequential read and sequential write speed. Random accesses are generally small in size, while sequential accesses tend to be larger and thus we have the four Iometer tests we use in all of our reviews.
Our first test writes 4KB in a completely random pattern over an 8GB space of the drive to simulate the sort of random access that you'd see on an OS drive (even this is more stressful than a normal desktop user would see). I perform three concurrent IOs and run the test for 3 minutes. The results reported are in average MB/s over the entire time. We use both standard pseudo randomly generated data for each write as well as fully random data to show you both the maximum and minimum performance offered by SandForce based drives in these tests. The average performance of SF drives will likely be somewhere in between the two values for each drive you see in the graphs. For an understanding of why this matters, read our original SandForce article.
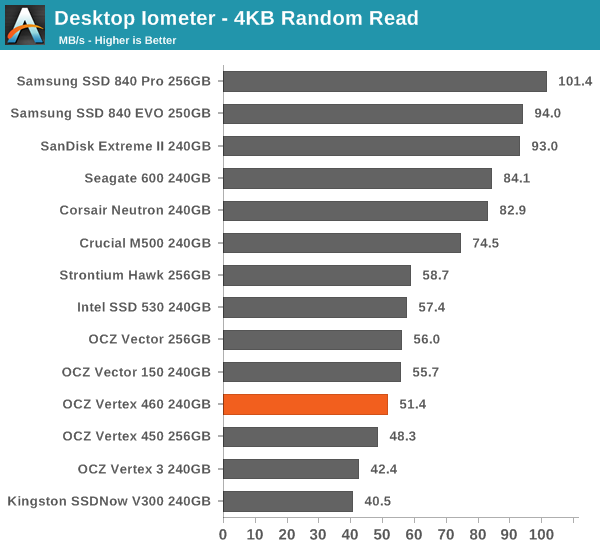
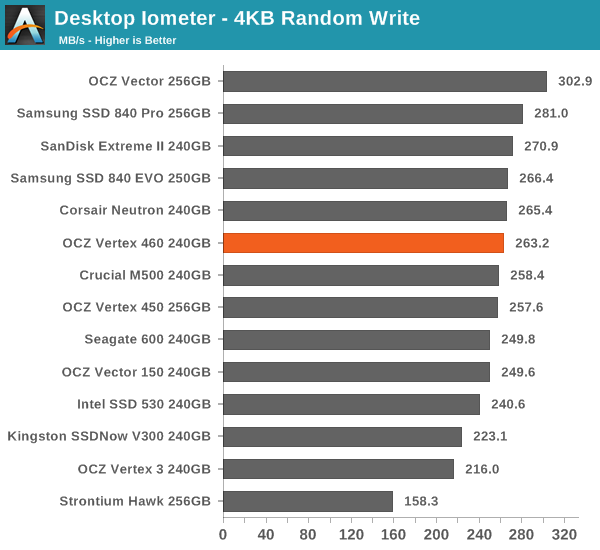
In random read/write tests the Vertex 460 and Vector 150 trade punches but the differences are minor. Our Vector 150 sample was tested a few months back so minor differences in firmware could account for the increased random read/write results, or it may simply be margin of error.
Sequential Read/Write Speed
To measure sequential performance I ran a 1 minute long 128KB sequential test over the entire span of the drive at a queue depth of 1. The results reported are in average MB/s over the entire test length.
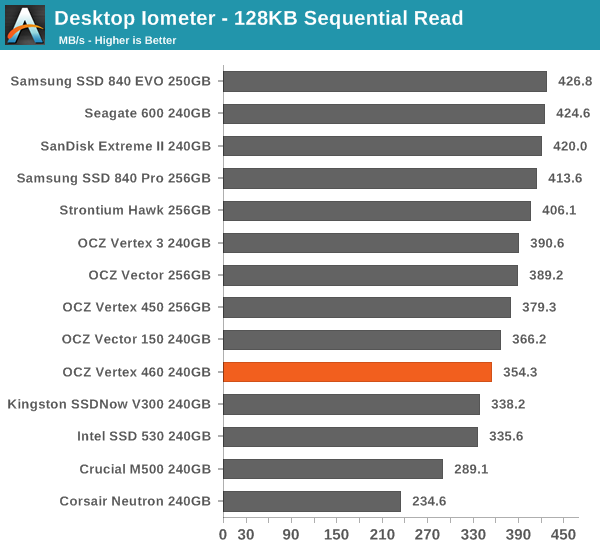
Same goes for sequential performance: the Vertex 460 and Vector 150 perform more or less equally.
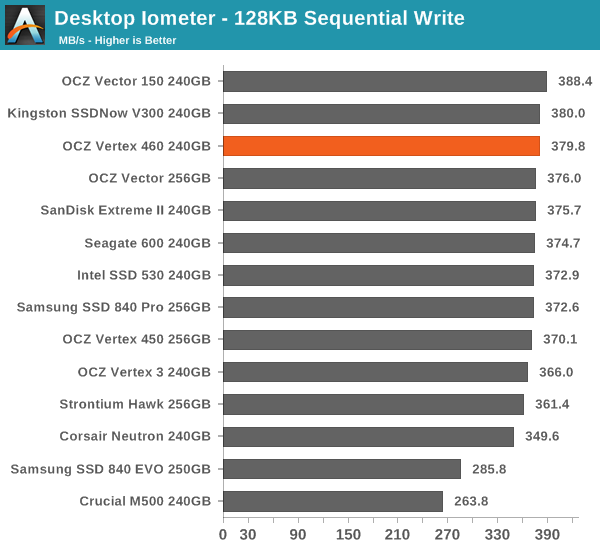
Sequential performance gives the Vector 150 a slight edge in both read and write results, but the difference is only a few percent at most.
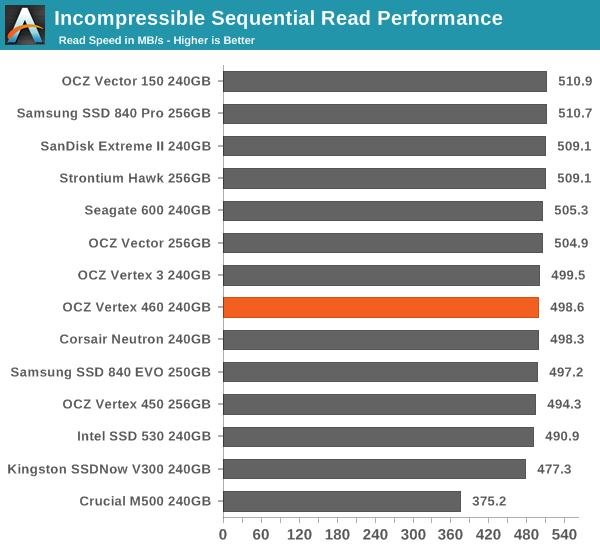
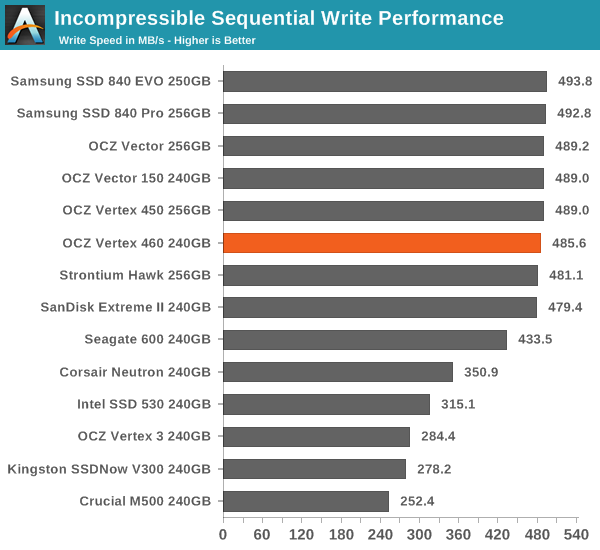
AS-SSD Incompressible Sequential Read/Write Performance
The AS-SSD sequential benchmark uses incompressible data for all of its transfers. The result is a pretty big reduction in sequential write speed on SandForce based controllers.


69 Comments
View All Comments
blanarahul - Wednesday, January 22, 2014 - link
The 250 GB 840 EVO achieves 260 MB/s write speeds. 120 GB EVO achieves 140 MB/s. 500 GB EVO should achieve 520 MB/s bit it only achieves 420 MB/s. Why??blanarahul - Wednesday, January 22, 2014 - link
I am talking about non-Turbowrite speeds btw.rufuselder - Thursday, October 9, 2014 - link
OCZ Vertex 460 is one of the worst options for storage out there in my opinion (each time I try it out, I get just as disappointed). /Rufus from http://www.consumertop.com/best-computer-storage-g...DanNeely - Wednesday, January 22, 2014 - link
Having more NAND dies to multiiplex IO over only helps for some parts of the write process; and the more of them you have the less adding still more will help because other factors dominate more of the total time (Amdahl's law). As a result going to 500 from 250 gives less of a percentage boost than going to 250 from 120.I suspect in the case of the 500, because all the mid/top end drives are clustering in a narrow performance band, that SATA III bottlenecking is coming into play in addition to limitations within the SSD itself.
blanarahul - Wednesday, January 22, 2014 - link
Gee thanks. BTW, SATA III maxes out around 540 MB/s for writes. So it's a controller/firmware limitation.Gigaplex - Wednesday, January 22, 2014 - link
It's not that simple. You don't have to hit maximum utilisation to start feeling the limitations of SATA III.lmcd - Thursday, January 23, 2014 - link
I thought there weren't more packages but rather larger packages? If I'm wrong then yeah it's probably SATA limitations but if not it's because it's the same bandwidth allocated per packages as previously.lmcd - Thursday, January 23, 2014 - link
*weren't more packages once 250 GB is met, in the case of this model.Novuake - Wednesday, January 22, 2014 - link
Simple. Diminishing returns + limitations of SATA III.Shadowmaster625 - Wednesday, January 22, 2014 - link
It is amazing Toshiba would sully their own name by placing it next to "OCZ".