The AMD Radeon R9 290X Review
by Ryan Smith on October 24, 2013 12:01 AM EST- Posted in
- GPUs
- AMD
- Radeon
- Hawaii
- Radeon 200
Synthetics
As always we’ll also take a quick look at synthetic performance. The 290X shouldn’t pack any great surprises here since it’s still GCN, and as such bound to the same general rules for efficiency, but we do have the additional geometry processors and additional ROPs to occupy our attention.
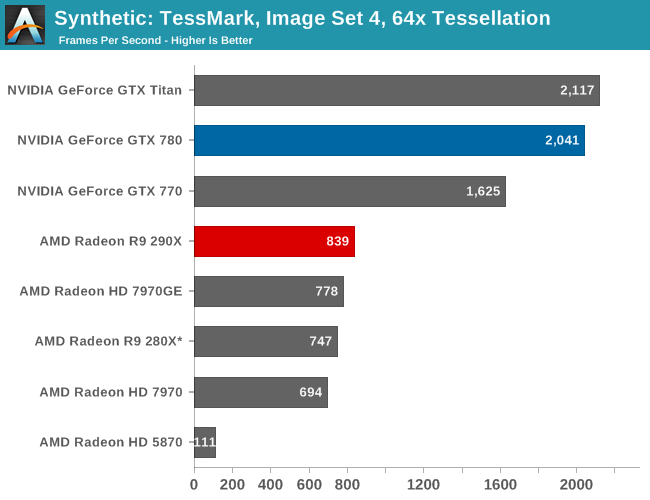
Right off the bat then, the TessMark results are something of a head scratcher. Whereas NVIDIA’s performance here has consistently scaled well with the number of SMXes, AMD’s seeing minimal scaling from those additional geometry processors on Hawaii/290X. Clearly Tessmark is striking another bottleneck on 290X beyond simple geometry throughput, though it’s not absolutely clear what that bottleneck is.
This is a tessellation-heavy benchmark as opposed to a simple massive geometry bencehmark, so we may be seeing a tessellation bottleneck rather than a geometry bottleneck, as tessellation requires its own set of heavy lifting to generate the necessary control points. The 12% performance gain is much closer to the 11% memory bandwidth gain than anything else, so it may be that the 280X and 290X are having to go off-chip to store tessellation data (we are after all using a rather extreme factor), in which case it’s a memory bandwidth bottleneck. Real world geometry performance will undoubtedly be better than this – thankfully for AMD this is the pathological tessellation case – but it does serve of a reminder of how much more tessellation performance NVIDIA is able to wring out of Kepler. Though the nearly 8x increase in tessellation performance since 5870 shows that AMD has at least gone a long way in 4 years, and considering the performance in our tessellation enabled games AMD doesn’t seem to be hurting for tessellation performance in the real world right now.
Moving on, we have our 3DMark Vantage texture and pixel fillrate tests, which present our cards with massive amounts of texturing and color blending work. These aren’t results we suggest comparing across different vendors, but they’re good for tracking improvements and changes within a single product family.
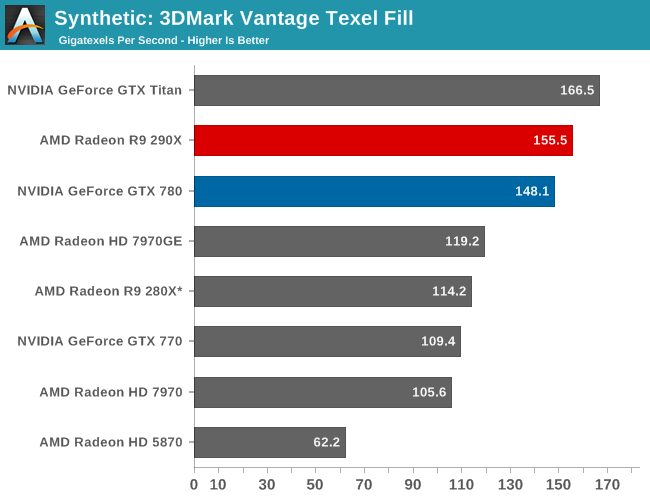
Looking first at texturing performance, we can see that texturing performance is essentially scaling 1:1 with what the theoretical numbers say it should. 36% better texturing performance over 280X is exactly in line with the increased number of texture units versus 280X, at the very least proving that 290X isn’t having any trouble feeding the increased number of texture units in this scenario.
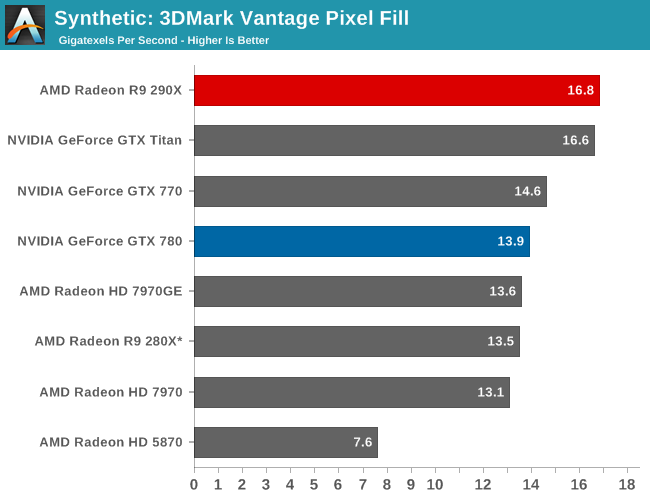
Meanwhile for our pixel fill rates the results are a bit more in the middle, reflecting the fact that this test is a mix of ROP bottlenecking and memory bandwidth bottlenecking. Remember, AMD doubled the ROPs versus 280X, but only gave it 11% more memory bandwidth. As a result the ROPs’ ability to perform is going to depend in part on how well color compression works and what can be recycled in the L2 cache, as anything else means a trip to the VRAM and running into those lesser memory bandwidth gains. Though the 290X does get something of a secondary benefit here, which is that unlike the 280X it doesn’t have to go through a memory crossbar and any inefficiencies/overhead it may add, since the number of ROPs and memory controllers is perfectly aligned on Hawaii.


396 Comments
View All Comments
SolMiester - Monday, October 28, 2013 - link
There is no way Origin PC or any other OEM would want to put this reference card in there systems..I cant wait to see RMA stats with this card...AMD blew the card after such a great GPU...how many times will they do this?polaco - Saturday, October 26, 2013 - link
This is an interesting article too for gamers that are looking for 4K:http://www.legitreviews.com/amd-radeon-r9-290x-vs-...
dwade123 - Saturday, October 26, 2013 - link
All this shows is that GTX Titan is one efficient card. Better than both GTX 780 and AMD's offerings.ehpexs - Saturday, October 26, 2013 - link
Looks like AMD is a gen away from offereding a crossfire solution that can max out my triple crossovers @ 7680x1440Th-z - Sunday, October 27, 2013 - link
It seems AMD is pushing 290X really hard, to the point beyond its efficiency curve to try to win over larger chips with almost 1B more transistors from Nvidia. I wonder if reducing some ROPs and dedicate more die area to shader core may look like to 290X, or to go all in, designing a chip as large as Nvidia's top parts.Ytterbium - Sunday, October 27, 2013 - link
I'm sad they've gone to 1/8th FP, the 280X is a better compute card!Animalosity - Sunday, October 27, 2013 - link
Why can't people just accept that AMD has beaten Nvidia in every shape and form this time. Yeah, its always been back and forth. And it will again in the future, but for now AMD has the crown for everything except for power/sound levels. Keep in mind that not only does AMD own both next gen consoles, they are also running every one of these benchmarks on beta drivers which means that they will only continue to get better. Add mantle to the equation and Titan will have absolutely zero purpose in life. It was a good card. RIP Kepler.Vortac - Sunday, October 27, 2013 - link
Well, let's point out again that Titan has a much better FP64 performance, approx. 2.5x better than 290X, so "absolutely zero purpose" is not entirely correct. Of course, if you don't care about computing, then obviously 290X is a much better choice now.Luke7 - Sunday, October 27, 2013 - link
Are you talking about this?http://www.sisoftware.co.uk/?d=qa&f=gpu_financ...
Vortac - Sunday, October 27, 2013 - link
In this interesting review Titan is pitted against 7970 which has 1/4 FP64 performance and is indeed very good for double precision calculations, especially with OpenCL. 290X has 1/8 FP64 and its double precision performance is worse than 7970, leaving Titan with some space to breathe.