Corsair Force LS (240GB) Review
by Kristian Vättö on September 25, 2013 12:00 AM ESTAnandTech Storage Bench 2013
When Anand built the AnandTech Heavy and Light Storage Bench suites in 2011 he did so because we didn't have any good tools at the time that would begin to stress a drive's garbage collection routines. Once all blocks have a sufficient number of used pages, all further writes will inevitably trigger some sort of garbage collection/block recycling algorithm. Our Heavy 2011 test in particular was designed to do just this. By hitting the test SSD with a large enough and write intensive enough workload, we could ensure that some amount of GC would happen.
There were a couple of issues with our 2011 tests that we've been wanting to rectify however. First off, all of our 2011 tests were built using Windows 7 x64 pre-SP1, which meant there were potentially some 4K alignment issues that wouldn't exist had we built the trace on a system with SP1. This didn't really impact most SSDs but it proved to be a problem with some hard drives. Secondly, and more recently, we've shifted focus from simply triggering GC routines to really looking at worst-case scenario performance after prolonged random IO.
For years we'd felt the negative impacts of inconsistent IO performance with all SSDs, but until the S3700 showed up we didn't think to actually measure and visualize IO consistency. The problem with our IO consistency tests is that they are very focused on 4KB random writes at high queue depths and full LBA spans—not exactly a real world client usage model. The aspects of SSD architecture that those tests stress however are very important, and none of our existing tests were doing a good job of quantifying that.
We needed an updated heavy test, one that dealt with an even larger set of data and one that somehow incorporated IO consistency into its metrics. We think we have that test. The new benchmark doesn't even have a name, we've just been calling it The Destroyer (although AnandTech Storage Bench 2013 is likely a better fit for PR reasons).
Everything about this new test is bigger and better. The test platform moves to Windows 8 Pro x64. The workload is far more realistic. Just as before, this is an application trace based test—we record all IO requests made to a test system, then play them back on the drive we're measuring and run statistical analysis on the drive's responses.
Imitating most modern benchmarks Anand crafted the Destroyer out of a series of scenarios. For this benchmark we focused heavily on Photo editing, Gaming, Virtualization, General Productivity, Video Playback and Application Development. Rough descriptions of the various scenarios are in the table below:
| AnandTech Storage Bench 2013 Preview—The Destroyer | ||||||||||||
| Workload | Description | Applications Used | ||||||||||
| Photo Sync/Editing | Import images, edit, export | Adobe Photoshop CS6, Adobe Lightroom 4, Dropbox | ||||||||||
| Gaming | Download/install games, play games | Steam, Deus Ex, Skyrim, Starcraft 2, BioShock Infinite | ||||||||||
| Virtualization | Run/manage VM, use general apps inside VM | VirtualBox | ||||||||||
| General Productivity | Browse the web, manage local email, copy files, encrypt/decrypt files, backup system, download content, virus/malware scan | Chrome, IE10, Outlook, Windows 8, AxCrypt, uTorrent, AdAware | ||||||||||
| Video Playback | Copy and watch movies | Windows 8 | ||||||||||
| Application Development | Compile projects, check out code, download code samples | Visual Studio 2012 | ||||||||||
While some tasks remained independent, many were stitched together (e.g. system backups would take place while other scenarios were taking place). The overall stats give some justification to what we've been calling this test internally:
| AnandTech Storage Bench 2013 Preview—The Destroyer, Specs | |||||||||||||
| The Destroyer (2013) | Heavy 2011 | ||||||||||||
| Reads | 38.83 million | 2.17 million | |||||||||||
| Writes | 10.98 million | 1.78 million | |||||||||||
| Total IO Operations | 49.8 million | 3.99 million | |||||||||||
| Total GB Read | 1583.02 GB | 48.63 GB | |||||||||||
| Total GB Written | 875.62 GB | 106.32 GB | |||||||||||
| Average Queue Depth | ~5.5 | ~4.6 | |||||||||||
| Focus | Worst-case multitasking, IO consistency | Peak IO, basic GC routines | |||||||||||
SSDs have grown in their performance abilities over the years, so we wanted a new test that could really push high queue depths at times. The average queue depth is still realistic for a client workload, but the Destroyer has some very demanding peaks. When we first introduced the Heavy 2011 test, some drives would take multiple hours to complete it; today most high performance SSDs can finish the test in under 90 minutes. The Destroyer? So far the fastest we've seen it go is 10 hours. Most high performance SSDs we've tested seem to need around 12—13 hours per run, with mainstream drives taking closer to 24 hours. The read/write balance is also a lot more realistic than in the Heavy 2011 test. Back in 2011 we just needed something that had a ton of writes so we could start separating the good from the bad. Now that the drives have matured, we felt a test that was a bit more balanced would be a better idea.
Despite the balance recalibration, there's just a ton of data moving around in this test. Ultimately the sheer volume of data here and the fact that there's a good amount of random IO courtesy of all of the multitasking (e.g. background VM work, background photo exports/syncs, etc...) makes the Destroyer do a far better job of giving credit for performance consistency than the old Heavy 2011 test. Both tests are valid; they just stress/showcase different things. As the days of begging for better random IO performance and basic GC intelligence are over, we wanted a test that would give us a bit more of what we're interested in these days. As Anand mentioned in the S3700 review, having good worst-case IO performance and consistency matters just as much to client users as it does to enterprise users.
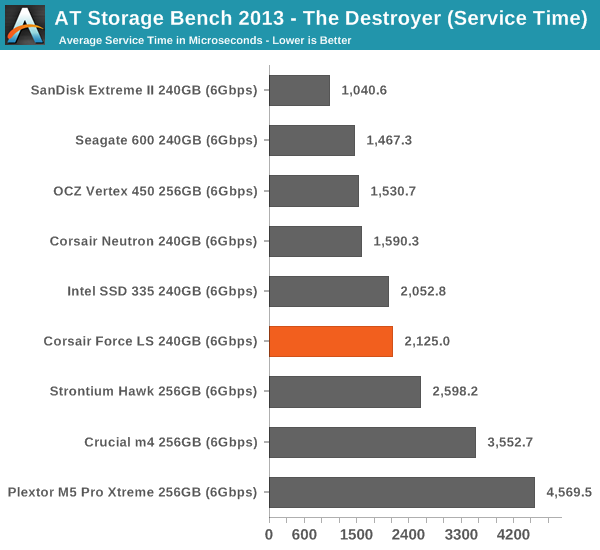
We're reporting two primary metrics with the Destroyer: average data rate in MB/s and average service time in microseconds. The former gives you an idea of the throughput of the drive during the time that it was running the Destroyer workload. This can be a very good indication of overall performance. What average data rate doesn't do a good job of is taking into account response time of very bursty (read: high queue depth) IO. By reporting average service time we heavily weigh latency for queued IOs. You'll note that this is a metric we've been reporting in our enterprise benchmarks for a while now. With the client tests maturing, the time was right for a little convergence.
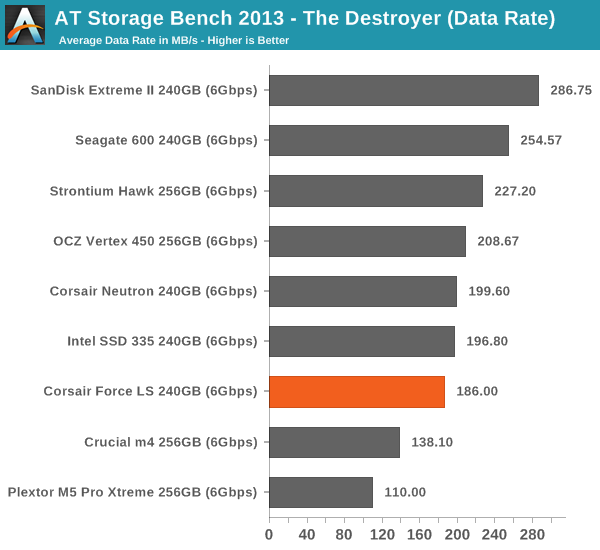
Our new Storage Bench 2013 reillustrates the IO consistency results. The Force LS does okay but it's clearly far behind the fastest SSDs of today. For an average user this shouldn't be an issue as the SSD shouldn't end up in steady-state in a TRIM supported environment but for a heavy user this can be a concern.


25 Comments
View All Comments
LtGoonRush - Wednesday, September 25, 2013 - link
Crucial has had a pretty poor record with firmware issues, particularly on the M4. Even given the lower endurance of TLC NAND I think it is a reasonable to expect the Samsung 840 Evo to be a more reliable drive for most users.Bob Todd - Wednesday, September 25, 2013 - link
Other than the admittedly awful SMART Power On Hours bug that was fixed a long time ago, I think you need to back up that statement. Crucial has been one of the go-to SSD makers for a lot of people specifically for the reliability (along with Intel/Samsung).1Angelreloaded - Tuesday, October 1, 2013 - link
As long as it lasts 3-5 years, Who cares? by then you should be migrating to newer ones anyways and recycle it as a cache drive.JDG1980 - Wednesday, September 25, 2013 - link
I'd be concerned about reliability with a new, unproven controller - especially when it comes from a company I've never heard of before.It sounds like Marvell controllers are inexpensive, but the cost of each company writing its own firmware drives prices up. I'd like to see a Marvell-based SSD with open-source firmware.
SteelCity1981 - Wednesday, September 25, 2013 - link
I would have liked to have seen the Samsung 840 250gb EVO in rapid mode in this benchmark to see the extra performance increase.red12355 - Wednesday, September 25, 2013 - link
Sort of unrelated, but is there ever going to be an Intel 530 SSD review? It got released a while back but hardly has any reviews.I remember there was a 520 review before the SSD was even out.
Kristian Vättö - Wednesday, September 25, 2013 - link
Intel has not approached us about the SSD 530 yet. Let me check with them to see if we can get a review sample.romrunning - Wednesday, September 25, 2013 - link
The colors on these graphs are very hard to distinguish, especially when you hit over-laying "pastel" type of colors. Is it too difficult to get colors that are easier to distinguish?Kristian Vättö - Wednesday, September 25, 2013 - link
What kind of colors would work the best in your opinion? We are always open to suggestions in order to make our content more user-friendly :)bobbozzo - Thursday, September 26, 2013 - link
RGB + CMYK might work out.Yellow on white is usually hard to see though.
Also, you'd need one more color as there are 8 drives tested.
I wonder what Tufte would say...