Samsung SSD 840 EVO Review: 120GB, 250GB, 500GB, 750GB & 1TB Models Tested
by Anand Lal Shimpi on July 25, 2013 1:53 PM EST- Posted in
- Storage
- SSDs
- Samsung
- TLC
- Samsung SSD 840
AnandTech Storage Bench 2013
When I built the AnandTech Heavy and Light Storage Bench suites in 2011 I did so because we didn't have any good tools at the time that would begin to stress a drive's garbage collection routines. Once all blocks have a sufficient number of used pages, all further writes will inevitably trigger some sort of garbage collection/block recycling algorithm. Our Heavy 2011 test in particular was designed to do just this. By hitting the test SSD with a large enough and write intensive enough workload, we could ensure that some amount of GC would happen.
There were a couple of issues with our 2011 tests that I've been wanting to rectify however. First off, all of our 2011 tests were built using Windows 7 x64 pre-SP1, which meant there were potentially some 4K alignment issues that wouldn't exist had we built the trace on a system with SP1. This didn't really impact most SSDs but it proved to be a problem with some hard drives. Secondly, and more recently, I've shifted focus from simply triggering GC routines to really looking at worst case scenario performance after prolonged random IO. For years I'd felt the negative impacts of inconsistent IO performance with all SSDs, but until the S3700 showed up I didn't think to actually measure and visualize IO consistency. The problem with our IO consistency tests are they are very focused on 4KB random writes at high queue depths and full LBA spans, not exactly a real world client usage model. The aspects of SSD architecture that those tests stress however are very important, and none of our existing tests were doing a good job of quantifying that.
I needed an updated heavy test, one that dealt with an even larger set of data and one that somehow incorporated IO consistency into its metrics. I think I have that test. I've just been calling it The Destroyer (although AnandTech Storage Bench 2013 is likely a better fit for PR reasons).
Everything about this new test is bigger and better. The test platform moves to Windows 8 Pro x64. The workload is far more realistic. Just as before, this is an application trace based test - I record all IO requests made to a test system, then play them back on the drive I'm measuring and run statistical analysis on the drive's responses.
Imitating most modern benchmarks I crafted the Destroyer out of a series of scenarios. For this benchmark I focused heavily on Photo editing, Gaming, Virtualization, General Productivity, Video Playback and Application Development. Rough descriptions of the various scenarios are in the table below:
| AnandTech Storage Bench 2013 Preview - The Destroyer | ||||||||||||
| Workload | Description | Applications Used | ||||||||||
| Photo Sync/Editing | Import images, edit, export | Adobe Photoshop CS6, Adobe Lightroom 4, Dropbox | ||||||||||
| Gaming | Download/install games, play games | Steam, Deus Ex, Skyrim, Starcraft 2, BioShock Infinite | ||||||||||
| Virtualization | Run/manage VM, use general apps inside VM | VirtualBox | ||||||||||
| General Productivity | Browse the web, manage local email, copy files, encrypt/decrypt files, backup system, download content, virus/malware scan | Chrome, IE10, Outlook, Windows 8, AxCrypt, uTorrent, AdAware | ||||||||||
| Video Playback | Copy and watch movies | Windows 8 | ||||||||||
| Application Development | Compile projects, check out code, download code samples | Visual Studio 2012 | ||||||||||
While some tasks remained independent, many were stitched together (e.g. system backups would take place while other scenarios were taking place). The overall stats give some justification to what I've been calling this test internally:
| AnandTech Storage Bench 2013 Preview - The Destroyer, Specs | |||||||||||||
| The Destroyer (2013) | Heavy 2011 | ||||||||||||
| Reads | 38.83 million | 2.17 million | |||||||||||
| Writes | 10.98 million | 1.78 million | |||||||||||
| Total IO Operations | 49.8 million | 3.99 million | |||||||||||
| Total GB Read | 1583.02 GB | 48.63 GB | |||||||||||
| Total GB Written | 875.62 GB | 106.32 GB | |||||||||||
| Average Queue Depth | ~5.5 | ~4.6 | |||||||||||
| Focus | Worst case multitasking, IO consistency | Peak IO, basic GC routines | |||||||||||
SSDs have grown in their performance abilities over the years, so I wanted a new test that could really push high queue depths at times. The average queue depth is still realistic for a client workload, but the Destroyer has some very demanding peaks. When I first introduced the Heavy 2011 test, some drives would take multiple hours to complete it - today most high performance SSDs can finish the test in under 90 minutes. The Destroyer? So far the fastest I've seen it go is 10 hours. Most high performance I've tested seem to need around 12 - 13 hours per run, with mainstream drives taking closer to 24 hours. The read/write balance is also a lot more realistic than in the Heavy 2011 test. Back in 2011 I just needed something that had a ton of writes so I could start separating the good from the bad. Now that the drives have matured, I felt a test that was a bit more balanced would be a better idea.
Despite the balance recalibration, there's just a ton of data moving around in this test. Ultimately the sheer volume of data here and the fact that there's a good amount of random IO courtesy of all of the multitasking (e.g. background VM work, background photo exports/syncs, etc...) makes the Destroyer do a far better job of giving credit for performance consistency than the old Heavy 2011 test. Both tests are valid, they just stress/showcase different things. As the days of begging for better random IO performance and basic GC intelligence are over, I wanted a test that would give me a bit more of what I'm interested in these days. As I mentioned in the S3700 review - having good worst case IO performance and consistency matters just as much to client users as it does to enterprise users.
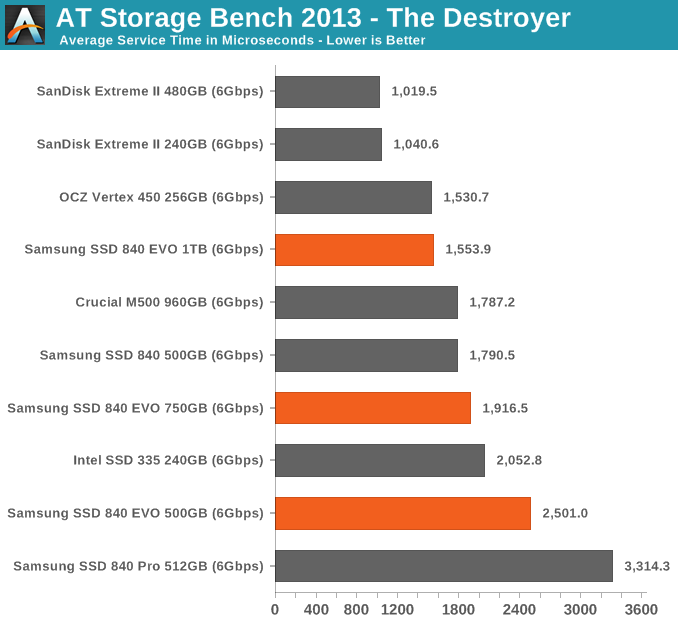
I'm reporting two primary metrics with the Destroyer: average data rate in MB/s and average service time in microseconds. The former gives you an idea of the throughput of the drive during the time that it was running the Destroyer workload. This can be a very good indication of overall performance. What average data rate doesn't do a good job of is taking into account response time of very bursty (read: high queue depth) IO. By reporting average service time we heavily weigh latency for queued IOs. You'll note that this is a metric I've been reporting in our enterprise benchmarks for a while now. With the client tests maturing, the time was right for a little convergence.
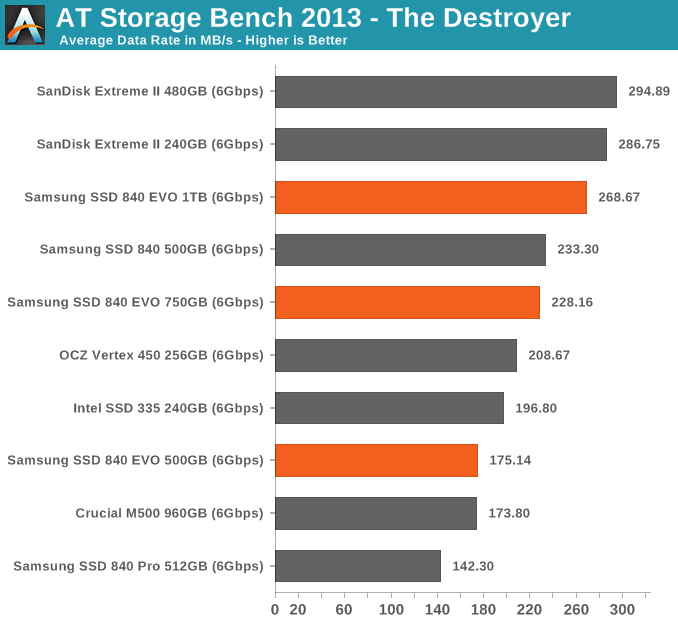
There's simply no comparison between the EVO and Crucial's M500. Even at half the capacity, the EVO does a better job in our consistency test. SanDisk's Extreme II remains the king here but that's more of a performance tuned part vs. something that offers better cost per GB. Note just how impactful the added spare is on giving the EVO an advantage over even the 840 Pro. It's so very important that 840 Pro owners keep as much free space on the drive as possible to keep performance high and consistent.


137 Comments
View All Comments
Riven98 - Thursday, July 25, 2013 - link
Anand,Thanks for the great article. I had just been thinking that there had been a downturn in the number of articles like these, which are the main reasons I visit on an almost daily basis.
chrnochime - Friday, July 26, 2013 - link
Still recommending a technology that's known to not last as long as the MLC. Yes the *extropolated* result indicates that its lifetime is far longer than advertised, but really, why when even M500 is not that slow in the first place and cost about the same, why risk going with the TLC? Not to mention Samsung's 830 has its fair share of horror stories as well...watersb - Friday, July 26, 2013 - link
Excellent review.How does write amplification scale as the disk fills up? Wouldn't a full disk fail more rapidly than a half-full one?
BobAjob2000 - Tuesday, January 28, 2014 - link
Hopefully wear leveling and TRIM/garbage collection algorithms should take care of your concerns. They should take existing unchanged 'cold' data and move it around to make way for regularly changed 'hot' data. This should reduce the impact of both data longevity and write amplification as it guides new writes to hit the 'freshest' unused or rarely written blocks on the disk and also helps to ensure that data goes not go 'stale' after being untouched for years. Different vendors use different algorithms that have evolved and improved over time. I think Samsung (being a RAM manufacturer) can possibly provide better RAM caches for their disks that may provide advantages for garbage collection and wear leveling algorithms by improving the available 'thinking space' for the caching and sorting/organizing of 'hot' data.Its all to do with managing the 'temperature' of your data somewhat like a data 'weather forecast' which can be very useful in the short term or for simple predictable/settled patterns but less practical for long term or unseasonal data storms.
Would like to see these things tested by 'what if' scenarios though to demonstrate the differences between different vendors algorithms.
xtreme2k - Friday, July 26, 2013 - link
Can anyone tell me why I am paying 90% of the price for 33% of the endurance of a drive?MrSpadge - Saturday, July 27, 2013 - link
Because endurance doesn't matter (very likely also for you), but price does.log - Friday, July 26, 2013 - link
Can you partition this drive and still take advantage of its features? ThnaksTimur Born - Friday, July 26, 2013 - link
I don't quite understand exactly why the Samsung RAPID software cache brings higher performance in *practice* than Windows' own cache? Using two software caches will lead to the same information being stored in RAM twice or even thrice, which is exactly what the Windows cache tries to avoid since XP days.That the usual benchmark programs get fooled is visible, as they think to be working without a software cache. So the higher values there are not surprising. But I am a bit puzzled why the Anand Storage Bench results increase, too?! Why is RAPID software caching better than Windows' own cache in this scenario? Or does the ASB bypass Windows' cache, too (like most benchmarks)?
By the way: ATTO allows the Windows cache to be turned ON for testing. My "old" Crucial M4 256 gets sees very high read results once ATTO makes use of Windows' cache. Only the write rates remain significantly smaller.
Therefor an ATTO test with combinations of either or both software caches (RAPID and Windows) would be interesting.
MrSpadge - Saturday, July 27, 2013 - link
I think it's because Samsung is being much more agressive with caching than Win dares to be, i.e. it holds files far longer before writing them, so they can be combined more efficiently but are longer at risk of being lost.Timur Born - Sunday, July 28, 2013 - link
I am not convinced about that yet, especially since you can turn off drive cache flushing via Device-Manager and thus should get an even more aggressive Windows cache behavior than what RAPID offers (which is reported to adhere to Windows' flush commands).The Windows cache is designed to keep data in RAM for as long as it's not needed for something else. Even more important, data is *directly* executed from inside the Windows cache instead of being copied back and forth between separate memory regions. This keeps duplication to a minimum (implemented since XP as far as I remember). So at least for reads the Windows cache is very useful, especially in combination with Superfetch, which is *not* disabled for SSDs btw (even Prefetch for the boot phase isn't disabled, but in practice it makes not much of a difference whether you boot with or without Prefetch from an SSD).
There is something funky going on with Windows' cache and the drive's onboard cache of my Crucial M4 in combination with ATTO (Windows cache enabled). Different block sizes get very different results, with some *larger* block sizes not benefiting from Windows' cache either at read or write, the latter depending on the block size chosen. Turning the drive's own cache flushing on/off via Device-Manager can have an impact on that, too.
In some cases I get less throughput with Windows cache than without (i.e. 512 kb block size with drive flushing on). This may be an issue of ATTO, though, because I also got some measurements where ATTO claimed a write speed of zero (0)! Turning off either drive cache flushing or the Windows cache or both helps ATTO to get meaningful measurements again.
So the main question remains: How and why would RAPID affect "real-world" performance on top of the Windows cache and does the Anand Storage Bench deliberately circumvent the Windows cache?
The reason I was looking at this review was that I am currently looking for a new SSD to build a desktop PC and the 840 EVO looks like the thing to buy. So once I get my hands on one myself I will just try RAPID myself. ;)