SanDisk Extreme II Review (480GB, 240GB, 120GB)
by Anand Lal Shimpi on June 3, 2013 7:19 PM ESTPerformance Consistency
In our Intel SSD DC S3700 review I introduced a new method of characterizing performance: looking at the latency of individual operations over time. The S3700 promised a level of performance consistency that was unmatched in the industry, and as a result needed some additional testing to show that. The reason we don't have consistent IO latency with SSDs is because inevitably all controllers have to do some amount of defragmentation or garbage collection in order to continue operating at high speeds. When and how an SSD decides to run its defrag and cleanup routines directly impacts the user experience. Frequent (borderline aggressive) cleanup generally results in more stable performance, while delaying that can result in higher peak performance at the expense of much lower worst case performance. The graphs below tell us a lot about the architecture of these SSDs and how they handle internal defragmentation.
To generate the data below I took a freshly secure erased SSD and filled it with sequential data. This ensures that all user accessible LBAs have data associated with them. Next I kicked off a 4KB random write workload across all LBAs at a queue depth of 32 using incompressible data. I ran the test for just over half an hour, no where near what we run our steady state tests for but enough to give me a good look at drive behavior once all spare area filled up.
I recorded instantaneous IOPS every second for the duration of the test. I then plotted IOPS vs. time and generated the scatter plots below. Each set of graphs features the same scale. The first two sets use a log scale for easy comparison, while the last set of graphs uses a linear scale that tops out at 50K IOPS for better visualization of differences between drives.
The high level testing methodology remains unchanged from our S3700 review. Unlike in previous reviews however, I did vary the percentage of the drive that I filled/tested depending on the amount of spare area I was trying to simulate. The buttons are labeled with the advertised user capacity had the SSD vendor decided to use that specific amount of spare area. If you want to replicate this on your own all you need to do is create a partition smaller than the total capacity of the drive and leave the remaining space unused to simulate a larger amount of spare area. The partitioning step isn't absolutely necessary in every case but it's an easy way to make sure you never exceed your allocated spare area. It's a good idea to do this from the start (e.g. secure erase, partition, then install Windows), but if you are working backwards you can always create the spare area partition, format it to TRIM it, then delete the partition. Finally, this method of creating spare area works on the drives we've tested here but not all controllers may behave the same way.
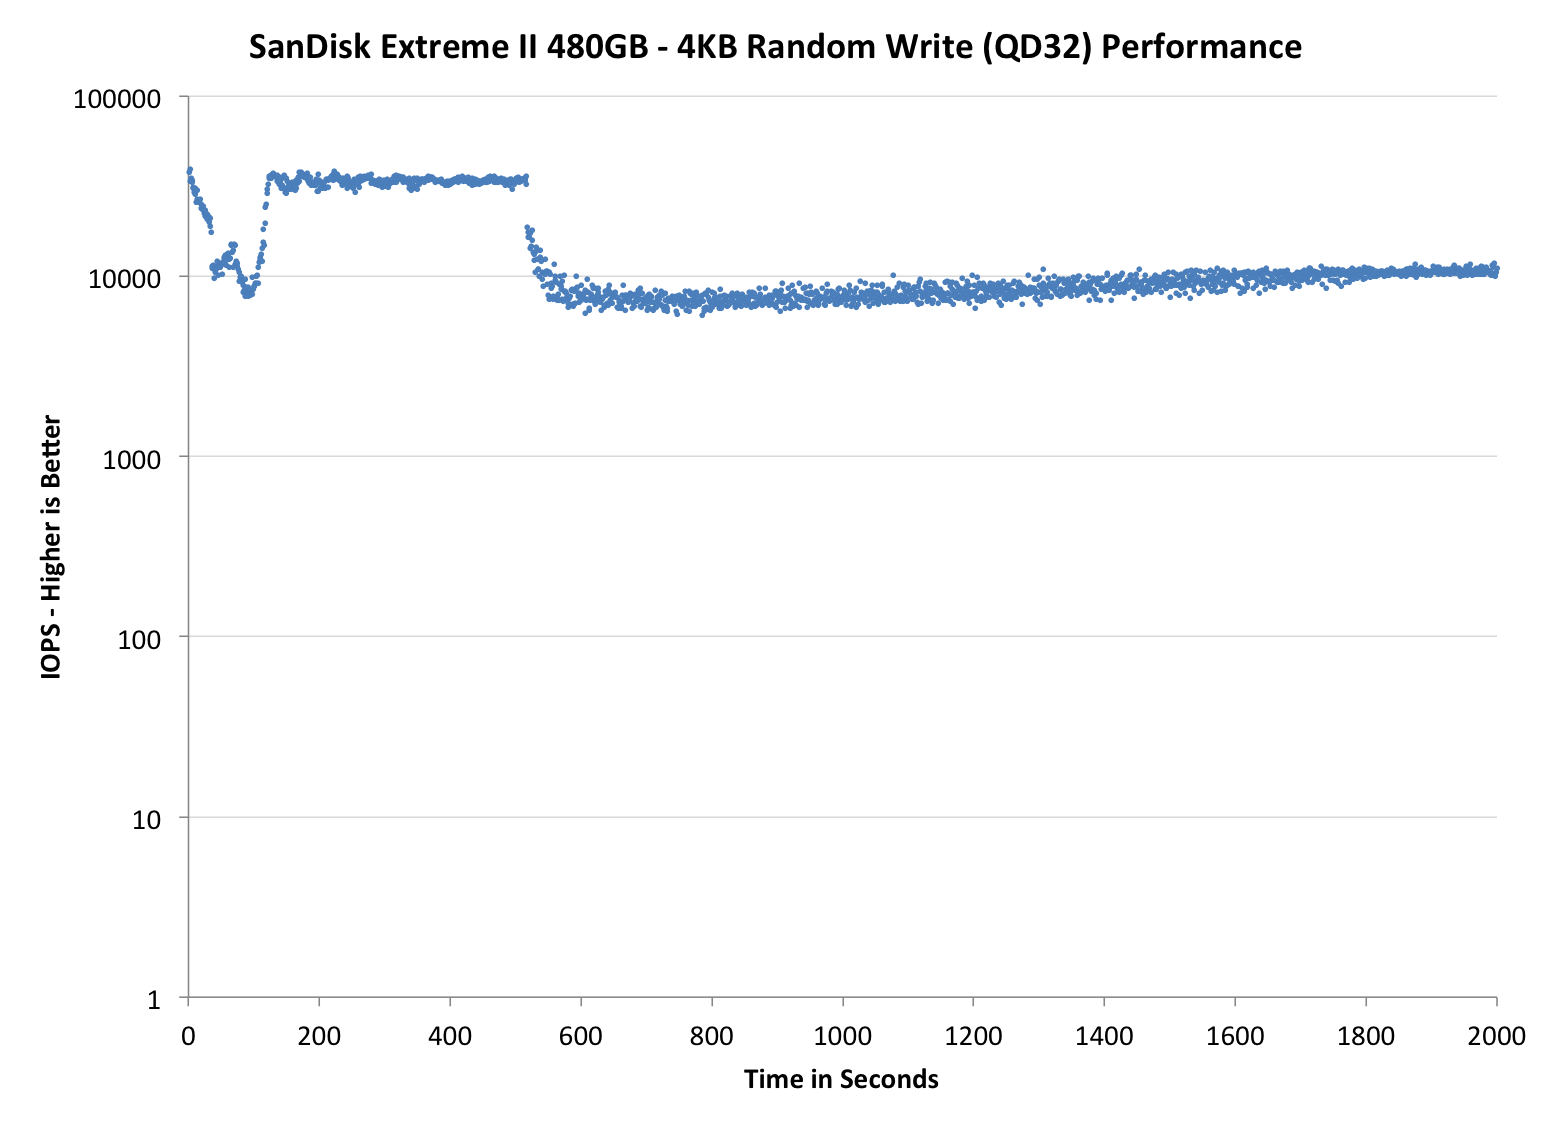
The first set of graphs shows the performance data over the entire 2000 second test period. In these charts you'll notice an early period of very high performance followed by a sharp dropoff. What you're seeing in that case is the drive allocating new blocks from its spare area, then eventually using up all free blocks and having to perform a read-modify-write for all subsequent writes (write amplification goes up, performance goes down).
The second set of graphs zooms in to the beginning of steady state operation for the drive (t=1400s). The third set also looks at the beginning of steady state operation but on a linear performance scale. Click the buttons below each graph to switch source data.
 |
|||||||||
| Corsair Neutron 240GB | Crucial M500 960GB | Samsung SSD 840 Pro 256GB | SanDisk Extreme II 480GB | Seagate 600 480GB | |||||
| Default | |||||||||
| 25% Spare Area | |||||||||
Um, hello, awesome? The SanDisk Extreme II is the first Marvell based consumer SSD to actually prioritize performance consistency. The Extreme II does significantly better than pretty much every other drive here with the exception of Corsair's Neutron. Note that increasing the amount of spare area on the drive actually reduces IO consistency, at least during the short duration of this test, as SanDisk's firmware aggressively attempts to improve the overall performance of the drive. Either way this is the first SSD from a big OEM supplier that actually delivers consistent performance in the worst case scenario.
 |
|||||||||
| Corsair Neutron 240GB | Crucial M500 960GB | Samsung SSD 840 Pro 256GB | SanDisk Extreme II 480GB | Seagate 600 480GB | |||||
| Default | |||||||||
| 25% Spare Area | |||||||||
 |
|||||||||
| Corsair Neutron 240GB | Crucial M500 960GB | Samsung SSD 840 Pro 256GB | SanDisk Extreme II 480GB | Seagate 600 480GB | |||||
| Default | |||||||||
| 25% Spare Area | |||||||||


51 Comments
View All Comments
jhh - Monday, June 3, 2013 - link
I wish there were more latency measurements. The only latency measurements were during the Destroyer benchmark. Latency under a lower load would be a useful metric. We are using NFS on top of ZFS, and latency is the biggest driver of performance.jmke - Tuesday, June 4, 2013 - link
there is still a lot of headroom left; storage is still the bottleneck of any computer; even with 24 SSDs in RAID 0 you still don't get lightening speed.Try a RAM drive which allows for 7700Mb/s write speed and 1000+mb/s at 4k random write
http://www.madshrimps.be/vbulletin/f22/12-software...
put some data on there, and you can now start stressing your CPU again :)
iwod - Tuesday, June 4, 2013 - link
The biggest bottleneck is Software. And even with my SSD running in SATA 2, my Core2Duo running Windows 8 can boot just 10 seconds. And Windows 7 within 15 seconds. With my Ivy Bridge +SATA 3 SSD running 1 - 2 seconds faster on boot time.In terms of consumer usage, 99% of us will properly need much faster Seq Read Write Speed. We are near the end of Random Write improvement. Where Random Read we could do with a lot more increase.
Once we move to SATA Express with 16Gbps, we could be moving the bottleneck back to CPU. And Since we are not going to get much more IPC and Ghz improvements, we are going to need software written with Multi Core in mind to see further improvement gains. So quite possible the next generation of Chipset and CPU will be the last of this generation before we have software move to Multi Core paradigm. Which, looking at it now is going to take a long time.
glugglug - Tuesday, June 4, 2013 - link
Outside of enterprise server workloads, I don't think you will notice a difference between current SSDs.However, higher random write IOPS is an indicator of lower write amplification, so it could be a useful signal to guess at how long before the drive wears out.
vinuneuro - Tuesday, December 3, 2013 - link
For most users, a long time ago it stopped mattering. In a machine used for Word/Excel/Powerpoint, Internet, Email, Movies, I stopped being able to perceive a difference day to day after the Intel X25-M/320. I tried Samsung 470's and 830's and got rid of both for cheaper Intel 320's.whyso - Monday, June 3, 2013 - link
Honestly for the average person and most enthusiasts SSDs are plenty fast and a difference isn't noticeable unless you are benchmarking (unless the drive is flat out horrible; bute the difference between a m400 and a 840 pro are unnoticible unless you are looking for it). The most important parts of an SSD then become performance consistency (though really few people actually apply a workload where that is a problem), power use (mainly for mobile), and RELIABILITY.TrackSmart - Monday, June 3, 2013 - link
I agree 100%. I can't tell the difference between the fast SSDs from the last generation and those of the current generation in day-to-day usage. The fact that Anand had to work so hard to create a testing environment that would show significant differences between modern SSDs is very telling. Given that reality, I choose drives that are likely to be highly reliable (Crucial, Intel, Samsung) over those that have better benchmark scores.jabber - Tuesday, June 4, 2013 - link
Indeed, considering the mech HDDs the average user out there is using is lucky to push more than 50MBps with typical double figure access times.When they experience just 150MBps with single digit access times they nearly wet their pants.
MBps isn't the key for average use (as in folks that are not pushing gigabytes of data around all day) it's the access times.
SSD reviews for many are getting like graphics card reviews that go "Well this new card pushed the framerate from 205FPS to an amazing 235FPS!"
Erm great..I guess.
old-style - Monday, June 3, 2013 - link
Great review.I think Anand's penchant for on-drive encryption ignores an important aspect of firmware: it's software like everything else. Correctness trumps speed in encryption, and I would rather trust kernel hackers to encrypt my data than an OEM software team responsible for an SSD's closed-source firmware.
I'm not trying to malign OEM programmers, but encryption is notoriously difficult to get right, and I think it would be foolish to assume that an SSD's onboard encryption is as safe as the mature and widely used dm-crypt and Bitlocker implementations in Linux and Windows.
In my mind the lack of firmware encryption is a plus: the team at SanDisk either had the wisdom to avoid home-brewing an encryption routine from scratch, or they had more time to concentrate on the actual operation of the drive.
thestryker - Monday, June 3, 2013 - link
http://www.anandtech.com/show/6891/hardware-accele...I'm not sure you are aware of what he is referring to.