NVIDIA GeForce GTX 780 Review: The New High End
by Ryan Smith on May 23, 2013 9:00 AM ESTCompute
Jumping into compute, we should see a mix of results here, with some tests favoring the GK110 based GTX 780’s more compute capable design, while other tests will punish it for not being a fast FP64 card like GTX Titan.
As always we'll start with our DirectCompute game example, Civilization V, which uses DirectCompute to decompress textures on the fly. Civ V includes a sub-benchmark that exclusively tests the speed of their texture decompression algorithm by repeatedly decompressing the textures required for one of the game’s leader scenes. While DirectCompute is used in many games, this is one of the only games with a benchmark that can isolate the use of DirectCompute and its resulting performance.
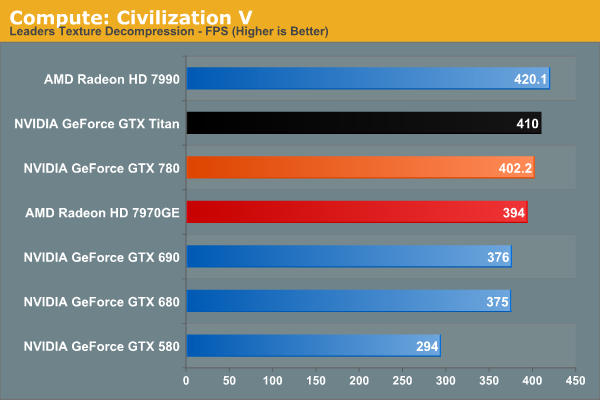
Civilization V’s DirectCompute performance is looking increasingly maxed out at the high end. At 402fps the GTX 780 may as well be tied with GTX Titan. On the other hand it’s a reminder that while we don’t always see NVIDIA do well in our more pure compute tests, it can deliver where it matters for games with DirectCompute.
Our next benchmark is LuxMark2.0, the official benchmark of SmallLuxGPU 2.0. SmallLuxGPU is an OpenCL accelerated ray tracer that is part of the larger LuxRender suite. Ray tracing has become a stronghold for GPUs in recent years as ray tracing maps well to GPU pipelines, allowing artists to render scenes much more quickly than with CPUs alone.
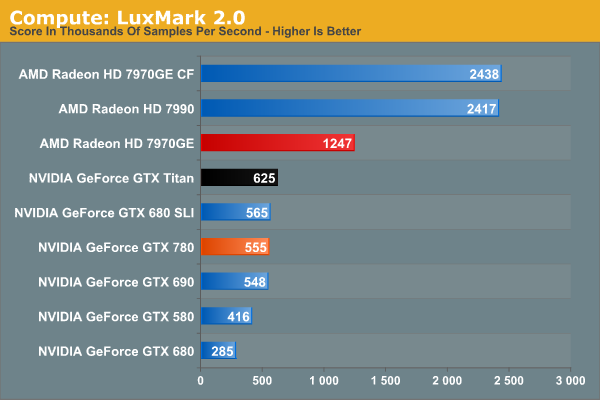
NVIDIA has never done well at LuxMark, and GTX 780 won’t change that. It’s greatly faster than GTX 680 and that’s about it. Kepler parts, including GK110, continue to have trouble with our OpenCL benchmarks, as evidenced by the fact that GTX 780 doesn’t beat GTX 580 by nearly as much as the generational improvements should lead to. GK110 is a strong compute GPU, but not in ways that LuxMark is going to benefit.
Our 3rd benchmark set comes from CLBenchmark 1.1. CLBenchmark contains a number of subtests; we’re focusing on the most practical of them, the computer vision test and the fluid simulation test. The former being a useful proxy for computer imaging tasks where systems are required to parse images and identify features (e.g. humans), while fluid simulations are common in professional graphics work and games alike.
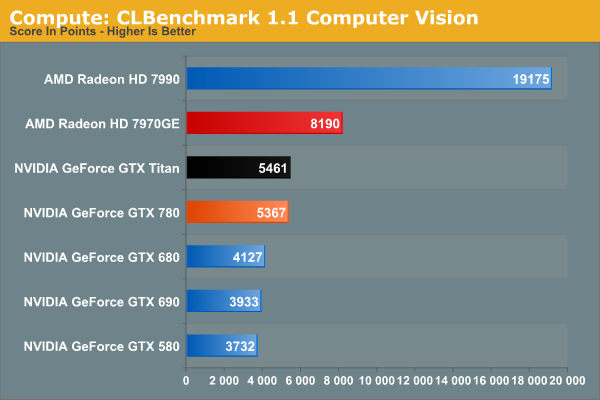
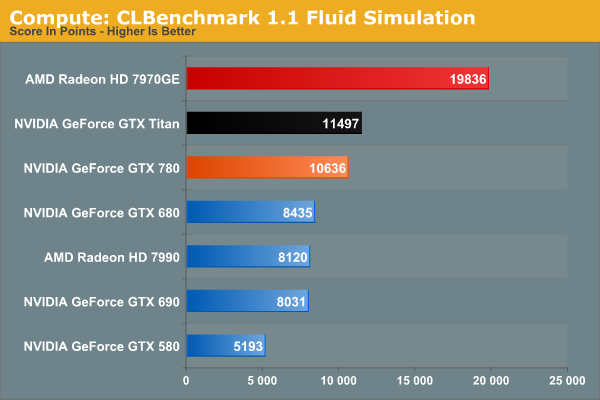
GTX 780 still struggles some at compute with CLBenchmark, but less so than with LuxMark. 7970GE is the clear winner here in both tests, while GTX 780 stays remarkably close to GTX Titan in performance. The fluid simulation in particular makes GTX 780 look good on a generational basis, more than doubling GTX 580’s performance.
Moving on, our 4th compute benchmark is FAHBench, the official Folding @ Home benchmark. Folding @ Home is the popular Stanford-backed research and distributed computing initiative that has work distributed to millions of volunteer computers over the internet, each of which is responsible for a tiny slice of a protein folding simulation. FAHBench can test both single precision and double precision floating point performance, with single precision being the most useful metric for most consumer cards due to their low double precision performance. Each precision has two modes, explicit and implicit, the difference being whether water atoms are included in the simulation, which adds quite a bit of work and overhead. This is another OpenCL test, as Folding @ Home has moved exclusively to OpenCL this year with FAHCore 17.
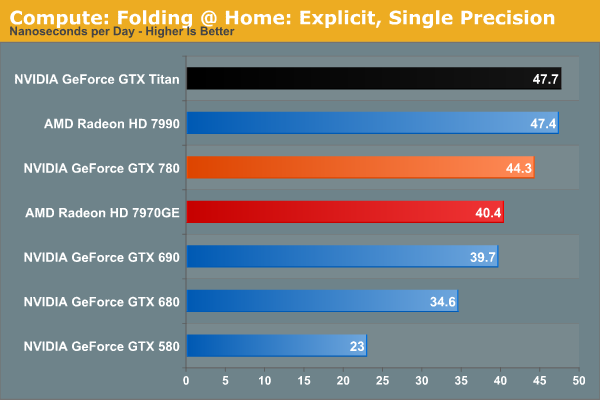
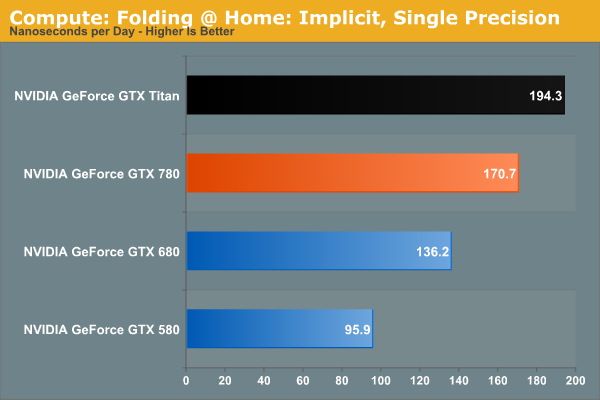
The Folding@Home group recently pushed out a major core update(FAHBench 1.2.0), which we’ve rerun on a number of cards and is reflected in our results. Unfortunately this version also broke single precision implicit on AMD GPUs and AMD’s latest drivers, so we only have NVIDIA GPUs for that section.
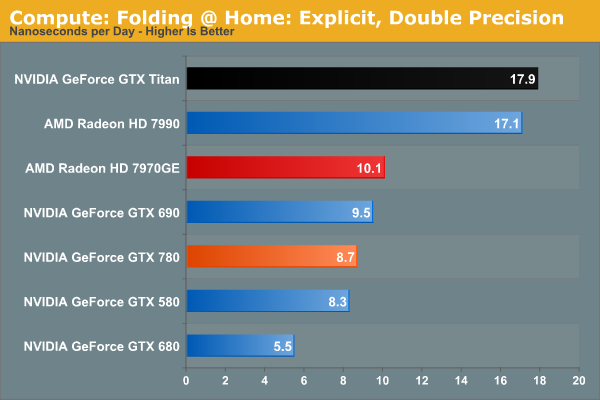
In any case, despite the fact that this is an OpenCL benchmark this is one of the cases where NVIDIA GPUs do well enough for themselves in single precision mode, with GTX 780 surpassing 7970GE, and falling behind only GTX Titan and the 7990. GTX 780 doesn’t necessarily benefit from GK110’s extra compute functionality, but it does see a performance improvement over GTX 680 that’s close to the theoretical difference in shader performance. Meanwhile in double precision mode, the lack of an uncapped double precision mode for GTX 780 means that it brings up the bottom of the charts compared to Titan and its 1/3 FP64 rate. Compute customers looking for a bargain NVIDIA card (relatively speaking) will need to stick with Titan.
Wrapping things up, our final compute benchmark is an in-house project developed by our very own Dr. Ian Cutress. SystemCompute is our first C++ AMP benchmark, utilizing Microsoft’s simple C++ extensions to allow the easy use of GPU computing in C++ programs. SystemCompute in turn is a collection of benchmarks for several different fundamental compute algorithms, as described in this previous article, with the final score represented in points. DirectCompute is the compute backend for C++ AMP on Windows, so this forms our other DirectCompute test.
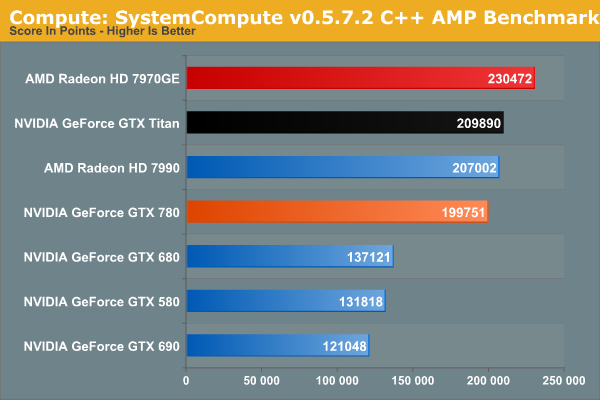
SystemCompute shows very clear gains over both the GTX 680 and GTX 580, while trailing the GTX Titan as expected. However like Titan, both trail the 7970GE.


155 Comments
View All Comments
littlebitstrouds - Thursday, May 23, 2013 - link
Being a system builder for video editors, I'd love to get some video rendering performance numbers.TheRealArdrid - Thursday, May 23, 2013 - link
The performance numbers on Far Cry 3 really show just how poorly Crysis was coded. There's no reason why new top-end hardware should still struggle on a 6 year old game.zella05 - Thursday, May 23, 2013 - link
Just no. crysis looks way better than farcry 3. dont forget, crysis is a pc game, farcry is a console portRyan Smith - Thursday, May 23, 2013 - link
On a side note, I like Far Cry 3, but I'd caution against using it as a baseline for a well forming game. It's an unusually fussy game. We have to disable HT to make it behave, and the frame pacing even on single GPU cards is more variable than what we see in most other games.zella05 - Thursday, May 23, 2013 - link
there has to be something wrong with your testing? how on earth can 2560x1440 only shave 1fps of all those cards? impossible. I have dual 580s on a dell 1440p monitor and I can say with complete conviction that when playing Crysis 3 you lose at LEAST 10% frame rate. Explain yourselves?WeaselITB - Thursday, May 23, 2013 - link
There are two 1080p graphs -- one "High Quality" and one "Very High Quality" ... the 1440p graph is "High Quality."Comparing HQ between the two gives 79.4 to 53.1 for the 780 ... seems about right to me.
-Weasel
BrightCandle - Thursday, May 23, 2013 - link
Both of your measures taken from FCAT have issues which I will try to explain below.1) The issue with the 95% point
If we take a game where 5% of the frames are being produced very inconsistently then the 95% point wont capture the issue. But worse is the fact that a 1 in 100 frame that takes twice as long is very noticeable when playing to everyone. Just 1% of the frames having an issue is enough to see a noticeable problem. Our eyes don't work by taking 95% of the frames, our eyes require a level of consistency on all frames. Thus the 95% point is not the eqvuialent of minimum FPS, that would be the 100% point. The 95% point is arbitary and ultimately not based on how we perceive the smoothness of frames. It captures AMDs current crossfire issue but it fails to have the resolution necessary as a metric to capture the general problem and compare single cards.
2) The issue with the delta averaging
By comparing to the average frame time this method would incorrectly categorise clearly better performing cards. Its the same mistake Tomshardware made. In essence if you have a game and sometimes that game is CPU limited (common) and then GPU limited the two graphics cards will show similar frame rates at some moments and the faster of them will show dramatically higher performance at other times. This makes the swing from the minimum/average to the high fps much wider. But it could be a perfectly consistent experience in the sense that frame to frame for the most part the variation is minimal. Your calculation would tell us the variation of the faster card was a problem, when actually it wasn't.
The reason that measure isn't right is that it fails to recognise the thing we humans see as a problem. We have issue with individual frames that take a long time. We also have issues with inconsistent delivery of animation in patterns. If we take 45 fps for example the 16/32/16/32 pattern that can produce in vsync is highly noticeable. The issue is that frame to frame we are seeing variation. This is why all the other review sites show the frame times, because the stuttering on a frame by frame basis really matters.
We don't particularly have issues with a single momentary jump up or down in frame rate, we might notice them but its momentary and then we adapt rapidly. What our brains do not adapt to rapidly is continuous patterns of odd delivery of frames. Thus any measure where you try to reduce the amount of data needs to be based on that moment by moment variation between individual or small numbers of frames, because big jumps up and down in fps that last for 10s of seconds are not a problem, the issue is the 10ms swing between two individual frames that keeps happening. You could look for patterns, you could use signal frequency analysis and various other techniques to tune out the "carrier" signal of the underlying FPS. But what you can't do is compare it to the average, that just blurs the entire picture. A game that started at 30 fps for half the trace and then was 60 fps for half the trace with no other variation is vastly better than one that continuously oscillates between 30 and 60 fps every other frame.
Its also important to understand that you analysis is missing fraps. Fraps isn't necessarily good for measuring what the cards are doing but it is essentially the best current way to measure what the game engine is doing. The GPU is impacting on the game simulation and its timing and variation in this affects what goes into the frames. So while FCAT captures if the frames come out smoothly it does not tell us anything about whether the contents is at the right time, fraps is what does that. NVidia is downplaying that tool because they have FCAT and are trying to show off their frame metering and AMD is downplaying it because their cards have issues but it is still a crucial measure. The ideal picture is both that the fraps times are consistent and the FCAT measures are consistent, they after all measure the input into the GPU and the output and we need both to get a true picture of the sub component.
Thus I am of the opinion your data doesn't currently show what you thought it did and your analysis needs work.
rscsrAT - Thursday, May 23, 2013 - link
As far as I understood the delta averaging, it adds the time difference between two adjacent frames.To make it clear, if you have 6 frames with 16/32/16/32/16/32ms per frame, you would calculate the value with (5*16)/((3*16+3*32)/6)=333%.
But if you have 6 framse with 16/16/16/32/32/32ms per frame, you would have 16/((3*16+3*32)/6)=67%.
Therefore you still have a higher value for a higher fluctuating framerate than with a steady framerate.
WeaselITB - Thursday, May 23, 2013 - link
For your #1 -- 95th percentile is a pretty common statistical analysis tool http://en.wikipedia.org/wiki/68-95-99.7_rule ... I'm assuming that they're assuming a normal distribution, which intuitively makes sense given that you'd expect most results to be close to the mean. I'd be interested in seeing the 3-sigma values, as that would further point out the extreme outliers, and would probably satisfy your desire for the "1%" as well.For your #2 -- they're measuring what you're describing, the differences between individual frametimes. Compare their graphs on the "Our First FCAT" page between the line graph of the frametimes of the cards and the bar graph after they massaged the data. The 7970GE has the smallest delta percentage, and the tightest line graph. The 7990 has the largest delta percentage (by far), and the line graph is all over the place. Their methodology of coming up with the "delta percentage" difference is sound.
-Weasel
jonjonjonj - Thursday, May 23, 2013 - link
amd get your act together so we have some competition. i really don't even see the point to this card at this price. what are they going to do for the 770? sell and even more crippled GK110 for $550? and the 760ti will be $450? or are they just going to sell the the 680 as a 770?