The Crucial/Micron M500 Review (960GB, 480GB, 240GB, 120GB)
by Anand Lal Shimpi on April 9, 2013 9:59 AM ESTRandom Read/Write Speed
The four corners of SSD performance are as follows: random read, random write, sequential read and sequential write speed. Random accesses are generally small in size, while sequential accesses tend to be larger and thus we have the four Iometer tests we use in all of our reviews.
Our first test writes 4KB in a completely random pattern over an 8GB space of the drive to simulate the sort of random access that you'd see on an OS drive (even this is more stressful than a normal desktop user would see). I perform three concurrent IOs and run the test for 3 minutes. The results reported are in average MB/s over the entire time. We use both standard pseudo randomly generated data for each write as well as fully random data to show you both the maximum and minimum performance offered by SandForce based drives in these tests. The average performance of SF drives will likely be somewhere in between the two values for each drive you see in the graphs. For an understanding of why this matters, read our original SandForce article.
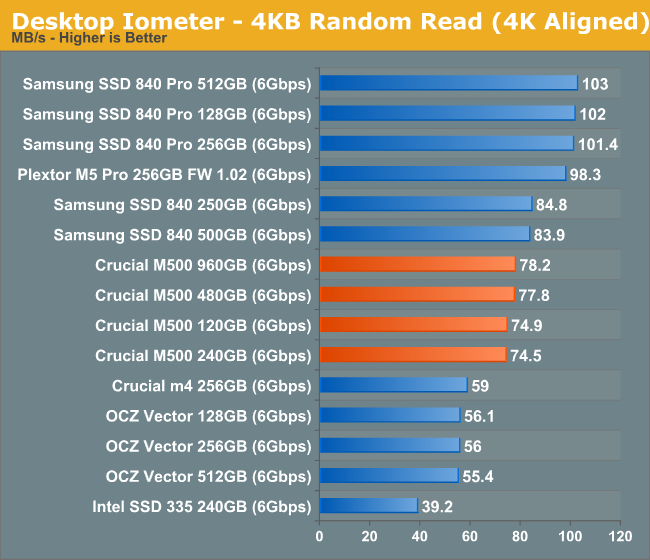
Random read performance starts out quite nicely. There's a good improvement over the old m4 and the M500 lineup finds itself hot on the heels of the Samsung SSD 840. There's not much variance between the various capacities here.
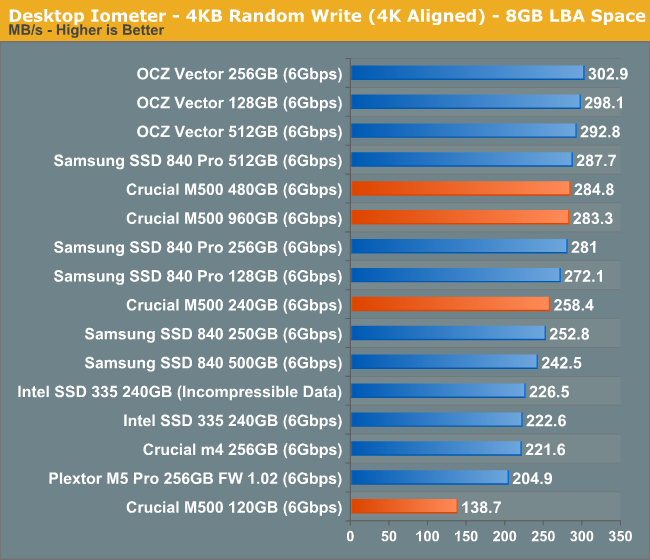
It's with the random write performance that we get some insight into how write parallelism works on the M500. The 480GB and 960GB drives deliver roughly the same performance, so all you really need to saturate the 9187 is 32 NAND die. The 240GB sees a slight drop in performance, but the 120GB version with only 8 NAND die sees the biggest performance drop. This is exactly why we don't see a 64GB M500 at launch using 128Gbit die.
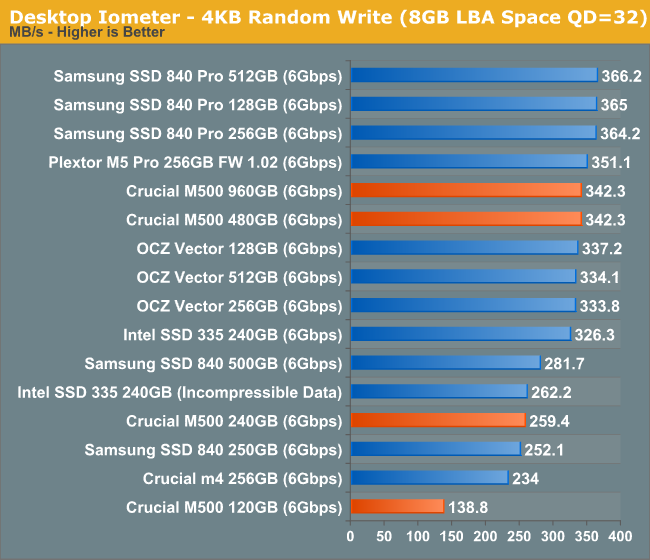
Ramping up queue depth causes some extra scaling on the 32/64 die drives, but the 240GB and 120GB parts are already at their limits. There physically aren't enough NAND die to see any tangible gains in performance between high and low queue depths here on the smaller drives. This is going to be a problem that everyone will have to deal with ultimately, the M500 just encounters it first.
Sequential Read/Write Speed
To measure sequential performance I ran a 1 minute long 128KB sequential test over the entire span of the drive at a queue depth of 1. The results reported are in average MB/s over the entire test length.
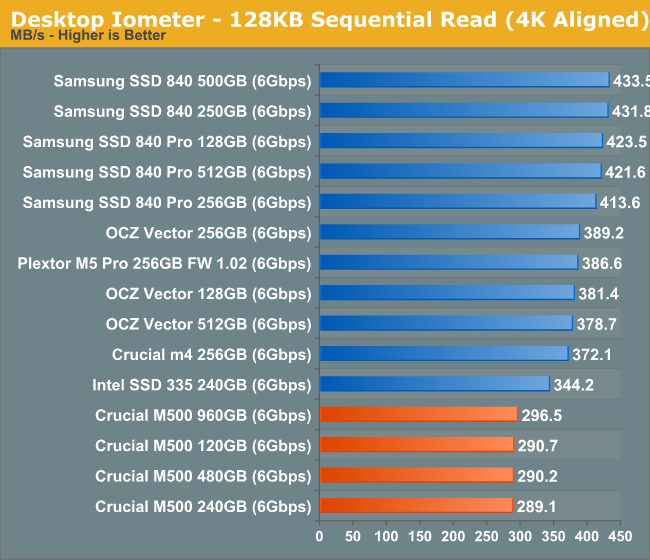
Low queue depth sequential read performance looks ok but the M500 is definitely not class leading here.
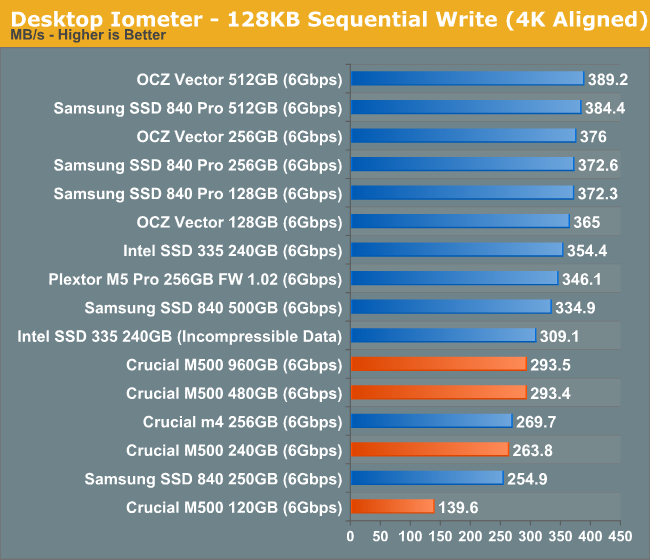
There's pretty much the same story when we look at sequential writes, although once again the 120GB M500 shows its limits very openly. The 840 and M500 have similar performance levels at the same capacity point, but the M500 is significantly behind the higher end offerings as you'd expect.
AS-SSD Incompressible Sequential Read/Write Performance
The AS-SSD sequential benchmark uses incompressible data for all of its transfers. The result is a pretty big reduction in sequential write speed on SandForce based controllers.
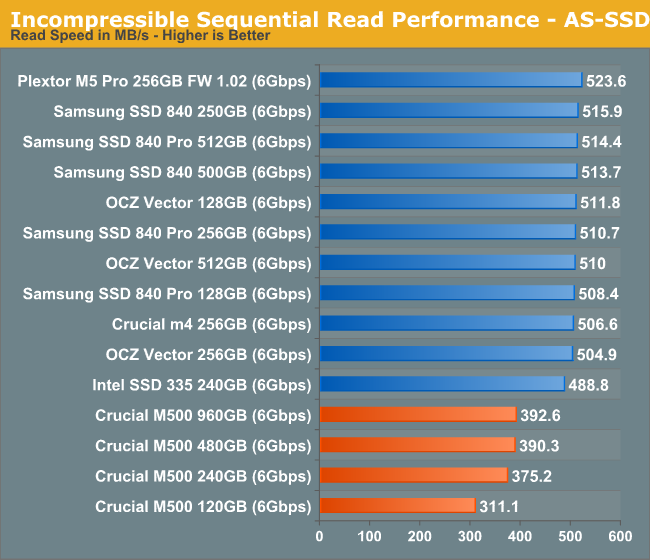
Ramping up queue depth we see a substantial increase in sequential read performance, but there's still a big delta between the M500 and all of the earlier drives.
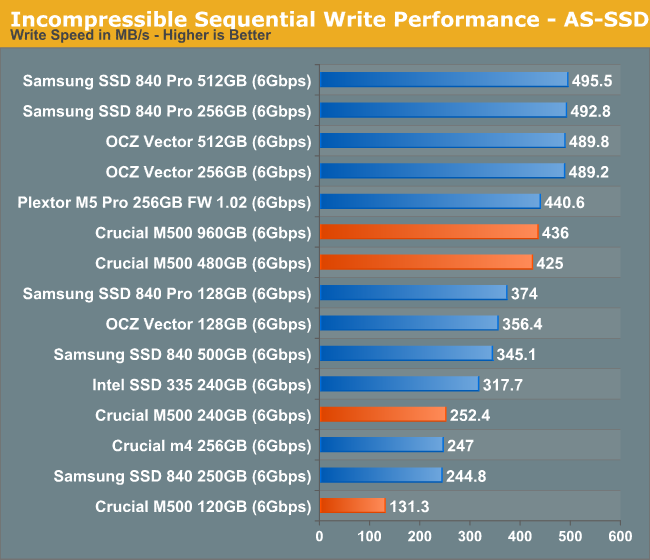
The high-queue depth sequential write story is a bit better for the M500. It's tangibly quicker than the 840 here.


111 Comments
View All Comments
BHSPitMonkey - Tuesday, April 9, 2013 - link
Correction: "securily" should read "securely" in the section about encryption.iaco - Tuesday, April 9, 2013 - link
Only 72 TB of writes? That must be a mistake. That's even worse than Samsung's TLC NAND with 1000 write cycles. At 500 GB, 1000 cycles is equal to 500 TB. 3000 cycles for MLC NAND is 1500 TB. Anand, please tell me the spec is wrong, otherwise this drive is not worth the price.Anand Lal Shimpi - Tuesday, April 9, 2013 - link
That's directly from the M500 datasheet. Note that Intel rates the 335 at 20GB of writes per day for 3 years or 21.9TB but explicitly calls that out as a minimum endurance. I suspect that's what this 72TB rating is as well. Samsung doesn't publish similar numbers for the 840 and everyone comes up with their endurance numbers in different ways so they wouldn't likely be comparable either.The NAND is no less reliable than previous 20nm versions, so I have no reason to believe we won't see significantly longer lifespan out of the M500 than just 72TB of writes.
Take care,
Anand
microlithx - Tuesday, April 9, 2013 - link
If you look at Micron's data sheets, particularly at the enterprise SATA SSDs, you'll see they report 7 PB. They won't guarantee it but they'll probably reach that if you overprovision accordingly.NotablePerson - Tuesday, April 9, 2013 - link
What I'm confused about is how the 72TB endurance rating is the same across the board for all four of the SSDs. Shouldn't there be at least SOME variance in their ratings on account of the additional NAND?Kristian Vättö - Tuesday, April 9, 2013 - link
I don't have the datasheet with me (I'm travelling this week) but that 72TB was not sequential writes. IIRC it was 90% random and 10% sequential (and a couple of different IO sizes too), hence the endurance rating. Anand should be able to confirm the exact methodology but 72TB sounds normal in my ears, some have ~30TB (but 100% 4KB random writes).Solid State Brain - Wednesday, April 10, 2013 - link
I believe this is their way of telling buyers that they do not officially support or endorse enterprise usage (ie more than 40 GiB/day) on these drives, although their NAND flash memory is specced for way more than just 72 TiB of writes especially on higher capacity models.I would expect the 960 GB (1 TiB) drive to unofficially endure for at least 1.5 PiB of writes (at 2x write amplification).
Solid State Brain - Wednesday, April 10, 2013 - link
I meant to say that the 960 GB model (894.07 GiB) has 1 TiB of flash memory installed on its PCB. The "missing" capacity is for overprovisioning purposes.comomolo - Friday, May 3, 2013 - link
I can't believe they sell a 1TB drive that will day after fully writing it just 72 times.theduckofdeath - Tuesday, April 9, 2013 - link
This was a bit disappointing, I think. Hopefully a FW update or two will improve the numbers a bit, otherwise it just feels like a step backwards if you're not going for the 1TB model.