OCZ Vector (256GB) Review
by Anand Lal Shimpi on November 27, 2012 9:10 PM ESTAnandTech Storage Bench 2011 - Light Workload
Our new light workload actually has more write operations than read operations. The split is as follows: 372,630 reads and 459,709 writes. The relatively close read/write ratio does better mimic a typical light workload (although even lighter workloads would be far more read centric).
The I/O breakdown is similar to the heavy workload at small IOs, however you'll notice that there are far fewer large IO transfers:
| AnandTech Storage Bench 2011 - Light Workload IO Breakdown | ||||
| IO Size | % of Total | |||
| 4KB | 27% | |||
| 16KB | 8% | |||
| 32KB | 6% | |||
| 64KB | 5% | |||
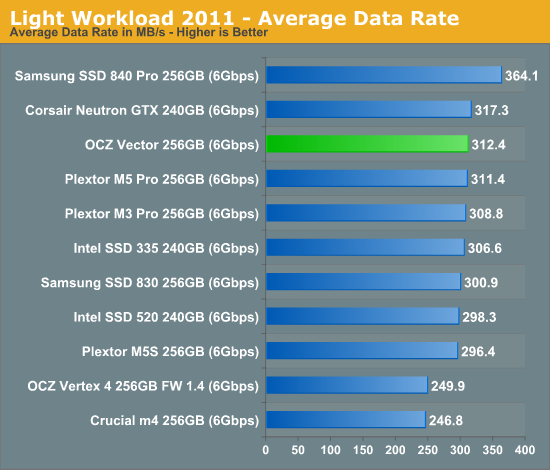
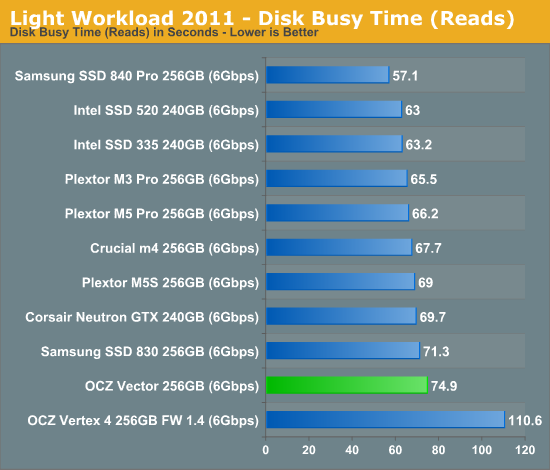
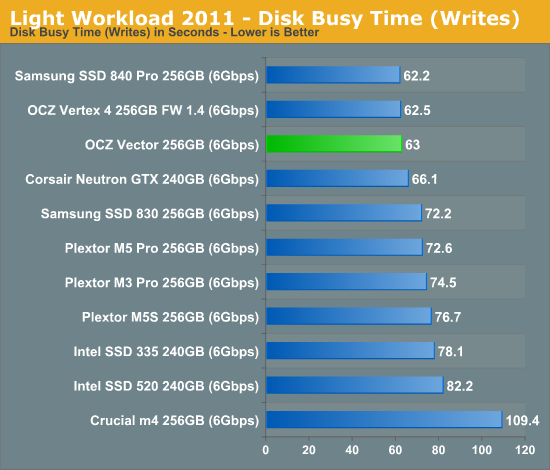
Our light workload remains Samsung's safe haven with the 840 Pro. OCZ's Vector does improve performance considerably over the Vertex 4 (+25%) but Samsung manages a 16% performance advantage here with the 840 Pro.


151 Comments
View All Comments
jeffrey - Tuesday, November 27, 2012 - link
Anand,I would love to have seen results using the 1.5 firmware for the 256GB Vertex 4. Going from 1.4 to 1.5 is non destructive. The inconsistency of graphs in other SSD reviews that included the 512GB Vertex 4 drive with 1.5 firmware and the 256GB Vertex 4 drive with 1.4 firmware drove me nuts.
When I saw the Barefoot 3 press release on Yahoo Finance, I immediately went to your site hoping to see the review. I was happy to see the article up, but when I saw your review sample was 256GB I feared you would not have updated the firmware on the Vertex 4 yet. Unfortunately, my fears were confirmed. I love your site, that's why I'm sharing my $.02 as a loyal reader.
Take care,
Jeffrey
Anand Lal Shimpi - Wednesday, November 28, 2012 - link
Some of the results are actually using the 1.5 firmware (IO consistency, steady state 4KB random write performance). We didn't notice a big performance difference between 1.4 and 1.5 which is why I didn't rerun on 1.5 for everything.Take care,
Anand
iwod - Tuesday, November 27, 2012 - link
Isn't this similar? Sandforce comes in, reached top speed in SATA 6Gbps, then other controller, Marvell, Barefoot managed to catch up. That is exactly what happen before with SATA 3Gbps Port. So in 2013 we would have controller and SSD all offering similar performance bottlenecked by its Port Speed.When are we going to see SATA Express that give us 20Gbps? We need those ASAP.
A5 - Wednesday, November 28, 2012 - link
SATA Express (on PCIe 3.0) will top out at 16 Gbps until PCIe 4.0 is out. This is the same bandwidth as single-channel DDR3-2133, by the way, so 16 Gbps should be plenty of performance for the next several years.extide - Wednesday, November 28, 2012 - link
Actually I believe Single Channel DDR-2133 is 16GiB a sec, not Gb a sec, so Sata Express is only ~1/8th the speed of single channel DDR3-2133jwilliams4200 - Wednesday, November 28, 2012 - link
It is good to see anandtech including results of performance consistency tests under a heavy write workload. However, there is a small or addition you should make for these results to be much more useful.You fill the SSDs up to 100% with sequential writes and I assume (I did not see a specification in your article) do 100% full-span 4KQD32 random writes. I agree that will give a good idea of worst-case performance, but unfortunately it does not give a good idea of how someone with that heavy a writeload would use these consumer SSDs.
Note that the consumer SSDs only have about 7% spare area reserved. However, if you overprovision them, some (all?) of them may make good use of the extra reserved space. The Intel S3700 only makes available 200GB / 264GiB of flash, which comes to 70.6% available, or 29.4% of the on-board flash is reserved as spare area.
What happens if you overprovision the Vector a similar amount? Or to take a round number, only use 80% of the available capacity of 256GB, which comes to just under 205GB.
I don't know how well the Vector uses the extra reserved space, but I do know that it makes a HUGE improvement on the 256GB Samsung 840 Pro. Below are some graphs of my own tests on the 840 Pro. I included graphs of Throughput vs. GB written, as well as latency vs. time. One the 80% graphs, I first wrote to all the sectors up to the 80% mark, then I did a 80% span 4KQD32 random write. On the 100% graphs, I did basically the same as anandtech did, filling up 100% of the LBAs then doing a 100% full-span 4KQD32 random write. Note that when the 840 Pro is only used up to 80%, it improves by a factor of about 4 in throughput, and about 15 in average latency (more than a 100 times improvement in max latency). It is approaching the performance of the Intel S3700. If I used 70% instead of 80% (to match the S3700), perhaps it would be even better.
Here are some links to my test data graphs:
http://i.imgur.com/MRZAM.png
http://i.imgur.com/Vvo1H.png
http://i.imgur.com/eYj7w.png
http://i.imgur.com/AMYoe.png
Ictus - Wednesday, November 28, 2012 - link
Just so I am clear, did you actually re create the partition utilitizing 80% of the space, or just keep the used space at 80% ?jwilliams4200 - Wednesday, November 28, 2012 - link
No partitions, no filesystems. I'm just writing to the raw device. In the 80% case, I just avoided writing to any LBAs higher than 80%.JellyRoll - Wednesday, November 28, 2012 - link
Excellent testing, very relevant, and thanks for sharing. How do you feel that the lack of TRIM in this type of testing affects the results? Do you feel that testing without a partition and TRIM would not provide an accurate depiction of real world performance?jwilliams4200 - Wednesday, November 28, 2012 - link
I just re-read your comment, and I thought perhaps you were asking about sequence of events instead of what I just answered you. The sequence is pretty much irrelevant since I did a secure erase before starting to write to the SSD.1) Secure erase SSD
2) Write to all LBAs up to 80%
3) 80% span 4KQD32 random write