OCZ Vertex 4 Review (256GB, 512GB)
by Anand Lal Shimpi on April 4, 2012 9:00 AM ESTAnandTech Storage Bench 2011
Two years ago we introduced our AnandTech Storage Bench, a suite of benchmarks that took traces of real OS/application usage and played them back in a repeatable manner. I assembled the traces myself out of frustration with the majority of what we have today in terms of SSD benchmarks.
Although the AnandTech Storage Bench tests did a good job of characterizing SSD performance, they weren't stressful enough. All of the tests performed less than 10GB of reads/writes and typically involved only 4GB of writes specifically. That's not even enough exceed the spare area on most SSDs. Most canned SSD benchmarks don't even come close to writing a single gigabyte of data, but that doesn't mean that simply writing 4GB is acceptable.
Originally I kept the benchmarks short enough that they wouldn't be a burden to run (~30 minutes) but long enough that they were representative of what a power user might do with their system.
Not too long ago I tweeted that I had created what I referred to as the Mother of All SSD Benchmarks (MOASB). Rather than only writing 4GB of data to the drive, this benchmark writes 106.32GB. It's the load you'd put on a drive after nearly two weeks of constant usage. And it takes a *long* time to run.
1) The MOASB, officially called AnandTech Storage Bench 2011 - Heavy Workload, mainly focuses on the times when your I/O activity is the highest. There is a lot of downloading and application installing that happens during the course of this test. My thinking was that it's during application installs, file copies, downloading and multitasking with all of this that you can really notice performance differences between drives.
2) I tried to cover as many bases as possible with the software I incorporated into this test. There's a lot of photo editing in Photoshop, HTML editing in Dreamweaver, web browsing, game playing/level loading (Starcraft II & WoW are both a part of the test) as well as general use stuff (application installing, virus scanning). I included a large amount of email downloading, document creation and editing as well. To top it all off I even use Visual Studio 2008 to build Chromium during the test.
The test has 2,168,893 read operations and 1,783,447 write operations. The IO breakdown is as follows:
| AnandTech Storage Bench 2011 - Heavy Workload IO Breakdown | ||||
| IO Size | % of Total | |||
| 4KB | 28% | |||
| 16KB | 10% | |||
| 32KB | 10% | |||
| 64KB | 4% | |||
Only 42% of all operations are sequential, the rest range from pseudo to fully random (with most falling in the pseudo-random category). Average queue depth is 4.625 IOs, with 59% of operations taking place in an IO queue of 1.
Many of you have asked for a better way to really characterize performance. Simply looking at IOPS doesn't really say much. As a result I'm going to be presenting Storage Bench 2011 data in a slightly different way. We'll have performance represented as Average MB/s, with higher numbers being better. At the same time I'll be reporting how long the SSD was busy while running this test. These disk busy graphs will show you exactly how much time was shaved off by using a faster drive vs. a slower one during the course of this test. Finally, I will also break out performance into reads, writes and combined. The reason I do this is to help balance out the fact that this test is unusually write intensive, which can often hide the benefits of a drive with good read performance.
There's also a new light workload for 2011. This is a far more reasonable, typical every day use case benchmark. Lots of web browsing, photo editing (but with a greater focus on photo consumption), video playback as well as some application installs and gaming. This test isn't nearly as write intensive as the MOASB but it's still multiple times more write intensive than what we were running in 2010.
As always I don't believe that these two benchmarks alone are enough to characterize the performance of a drive, but hopefully along with the rest of our tests they will help provide a better idea.
The testbed for Storage Bench 2011 has changed as well. We're now using a Sandy Bridge platform with full 6Gbps support for these tests.
AnandTech Storage Bench 2011 - Heavy Workload
We'll start out by looking at average data rate throughout our heavy workload test:
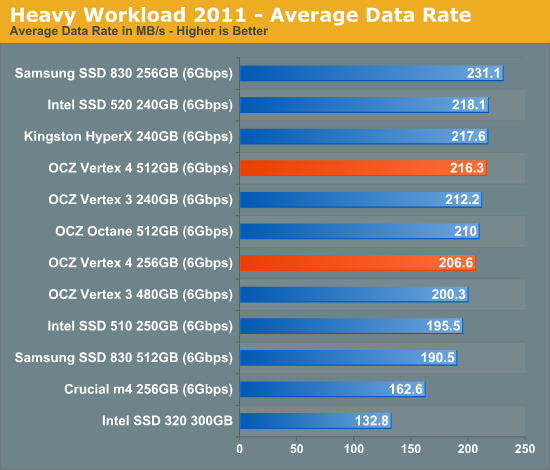
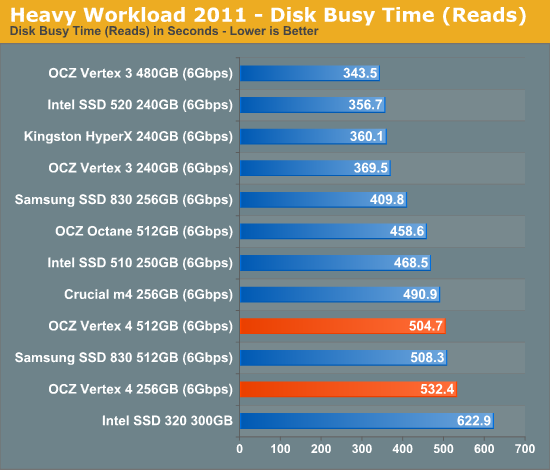
The overall score here is in-line with the SF-2281 solutions and OCZ's Octane. Our heavy workload is fairly write intensive, so I honestly expected the Vertex 4 to top the charts. Looking at the read/write breakdown explains why though:
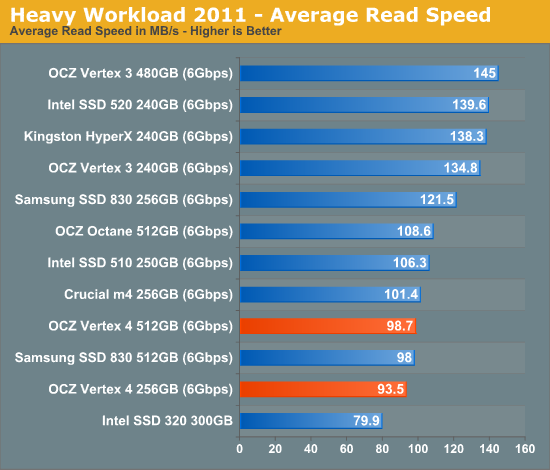
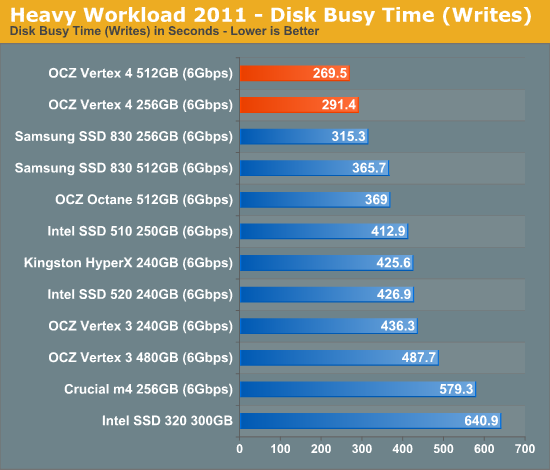
Here we see the Vertex 4's poor low queue-depth sequential read performance rearing its head once more. Look at the sequential write speed and you'll see where OCZ makes up for its shortcomings however. The Vertex 4 writes quicker than any drive we've tested.
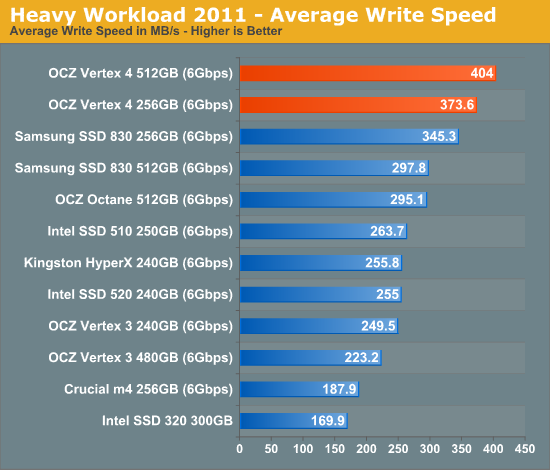
It's a tough tradeoff to come to terms with. The Vertex 4 delivers performance when it matters the most, but typically you want the absolute best performance regardless of workload. All of this may become moot if OCZ is able to address the situation with a firmware update in the coming weeks like it promised, but for buyers today it is something you have to think about.
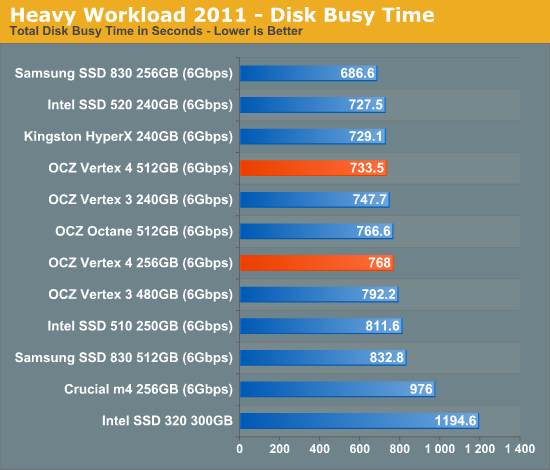
The next three charts just represent the same data, but in a different manner. Instead of looking at average data rate, we're looking at how long the disk was busy for during this entire test. Note that disk busy time excludes any and all idles, this is just how long the SSD was busy doing something:


127 Comments
View All Comments
iceman98343 - Thursday, April 5, 2012 - link
also listed at newegg for $179.99iceman98343 - Thursday, April 5, 2012 - link
please delete the above comment.DukeN - Thursday, April 5, 2012 - link
Until this has been out a year, that's all this amounts to.I'd rather pay for Intel/Crucial reliability than be OCZ's unpaid beta tester.
ceast3 - Monday, April 9, 2012 - link
The previous poster was correct, OCZ fixed the BSOD problem, not intel. Sandforce then released their fix to the other Manufacturers. Sandforce was the problem.... fact. So far all feedback is great with the Vertex 4, if that continues until Ivy Bridge and nothing better comes out, I'll be getting one! Vertex 3 and all other SF-2000 based SSD's showed problems right away, so I'm not worried.alfatekpt - Monday, April 9, 2012 - link
Why is your recommendation the Samsung's SSD 830 instead of OCZ vertex 3?Reliability?
Snigel - Sunday, April 22, 2012 - link
It's interesting to see the max values of power consumption, but it would also be interesting to factor in the speed of the drives.Usually a desktop user have a fixed amount of data that the disk needs to transfer, so continous load wattage is not that interesting compared to how much energy that is required to get the job done.
wattage * transfer time
For continous loads it would be more interesting to see something like
transfer speed / wattage
How much performance do I get compared to the energy I put in?
I could do these calculations manually of course, but I don't know how the write tests in the power consumption part are performed, so I cannot get the speed data from other charts.
vegemeister - Monday, May 7, 2012 - link
An SSD will be idle nearly all the time in nearly all desktop and laptop use cases. When the idle power consumption is > 1W, it doesn't much matter what the load power consumption is.Winning29 - Monday, April 30, 2012 - link
Hey guys. Check out my OCZ Vertex 4 speed test on YouTube. It shows my home PC's boot up time, then I load a VDI environment running on Citrix XenApp and VMware Workstation.http://youtu.be/YrnIcudM7zo
I'd welcome any comments, feedback or questions.
Bluemars_ - Tuesday, May 8, 2012 - link
New firmware 1.4's out, does it fix the low queue depth sequential read performance?twindragon6 - Friday, June 29, 2012 - link
From OCZ's website."CURRENT FIRMWARE RELEASE is v1.4.1.3"
I'm curious to see how this drive performs now with the newer firmware.