Bulldozer for Servers: Testing AMD's "Interlagos" Opteron 6200 Series
by Johan De Gelas on November 15, 2011 5:09 PM ESTMaxwell Render Suite
The developers of Maxwell Render Suite--Next Limit--aim at delivering a renderer that is physically correct and capable of simulating light exactly as it behaves in the real world. As a result their software has developed a reputation of being powerful but slow. And "powerful but slow" always attracts our interest as such software can be quite interesting benchmarks for the latest CPU platforms. Maxwell Render 2.6 was released less than two weeks ago, on November 2, and that's what we used.

We used the "Benchwell" benchmark, a scene with HDRI (high dynamic range imaging) developed by the user community. Note that we used the "30 day trial" version of Maxwell. We converted the time reported to render the scene in images rendered per hour to make it easier to interprete the numbers.
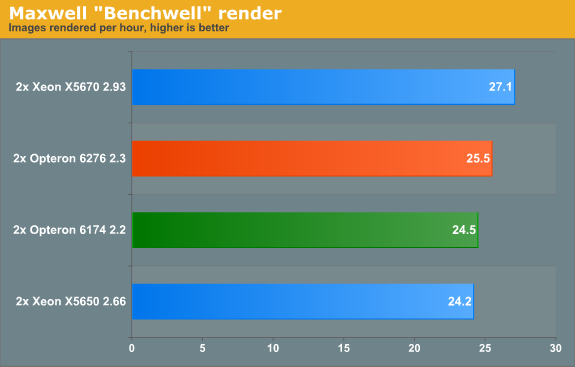
Since Magny-cours made its entrance, AMD did rather well in the rendering benchmarks and Maxwell is no difference. The Bulldozer based Opteron 6276 gives decent but hardly stunning performance: about 4% faster than the predecessor. Interestingly, the Maxwell renderer is not limited by SSE (Floating Point) performance. When we disable CMT, the AMD Opteron 6276 delivered only 17 frames per second. In other words the extra integer cluster delivers 44% higher performance. There is a good chance that the fact that you disable the second load/store unit by disabling CMT is the reason for the higher performance that the second integer cluster delivers.
Rendering: Blender 2.6.0
Blender is a very popular open source renderer with a large community. We tested with the 64-bit Windows version 2.6.0a. If you like, you can perform this benchmark very easily too. We used the metallic robot, a scene with rather complex lighting (reflections) and raytracing. To make the benchmark more repetitive, we changed the following parameters:
- The resolution was set to 2560x1600
- Antialias was set to 16
- We disabled compositing in post processing
- Tiles were set to 8x8 (X=8, Y=8)
- Threads was set to auto (one thread per CPU is set).
To make the results easier to read, we again converted the reported render time into images rendered per hour, so higher is better.
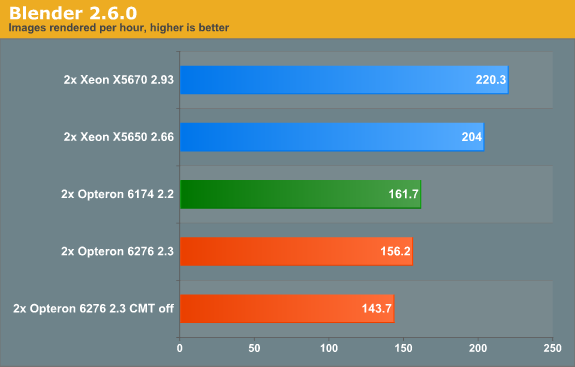
Last time we checked (Blender 2.5a2) in Windows, the Xeon X5670 was capable of 136 images per hour, while the Opteron 6174 did 113. So the Xeon was about 20% faster. Now the gap widens: the Xeon is now 36% faster. The interesting thing that we discovered is that the Opteron is quite a bit faster when benchmarked in linux. We will follow up with some Linux numbers in the next article. The Opteron 6276 is in this benchmark 4% slower than its older brother, again likely due in part to the newness of its architecture.


106 Comments
View All Comments
duploxxx - Thursday, November 17, 2011 - link
Very interesting review as usual Johan, thx. It is good to see that there are still people who want to thoroughly make reviews.While the message is clear on the MS OS of both power and performance i think it isn't on the VMware. First of all it is quite confusing to what settings exactly have been used in BIOS and to me it doesn't reflect the real final conclusion. If it ain't right then don't post it to my opinion and keep it for further review....
I have a beta version of interlagos now for about a month and the performance testing depending on bios settings have been very challenging.
When i see your results i have following thoughts.
performance: I don't think that the current vAPU2 was able to stress the 2x16core enough, what was the avarage cpu usage in ESXTOP during these runs? On top of that looking at the result score and both response times it is clear that the current BIOS settings aren't optimal in the balanced mode. As you already mentioned the system is behaving strange.
VMware themselves have posted a document for v5 regarding the power best practices which clearly mentions that these needs to be adapted. http://www.vmware.com/files/pdf/hpm-perf-vsphere5....
To be more precise, balanced has never been the right setting on VMware, the preferred mode has always been high performance and this is how we run for example a +400 vmware server farm. We rather use DPM to reduce power then to reduce clock speed since this will affected total performance and response times much more, mainly on the virtualization platform and OEM bios creations (lets say lack of in depth finetuning and options).
Would like to see new performance results and power when running in high performance mode and according the new vSphere settings....
JohanAnandtech - Thursday, November 17, 2011 - link
"l it is quite confusing to what settings exactly have been used in BIOS and to me it doesn't reflect the real final conclusion"http://www.anandtech.com/show/5058/amds-opteron-in...
You can see them here with your own eyes.
+ We configured the C-state mode to C6 as this is required to get the highest Turbo Core frequencies
"performance: I don't think that the current vAPU2 was able to stress the 2x16core enough, what was the avarage cpu usage in ESXTOP during these runs?"
93-99%.
"On top of that looking at the result score and both response times it is clear that the current BIOS settings aren't optimal in the balanced mode."
Balanced and high performance gave more or less the same performance. It seems that the ESX power manager is much better at managing p-states than the Windows one.
We are currently testing Balanced + c-states. Stay tuned.
duploxxx - Thursday, November 17, 2011 - link
thx for answers, i read the whole thread, just wasn't sure that you took the same settings for both windows and virtual.according to Vmware you shouldn't take balanced but rather OS controlled, i know my BIOS has that option, not sure for the supermicro one.
quite a strange result with the ESXTOP above 90% with same performance results, there just seems to be a further core scaling issue on the vAPU2 with the performance results or its just not using turbo..... we know that the module doesn't have the same performance but the 10-15% turbo is more then enough to level that difference which would still leave you with 8 more cores
When you put the power mode on high performance it should turbo all cores for the full length at 2.6ghz for the 6276, while you mention it results in same performance are you sure that the turbo was kicking in? ESXTOP CPU higher then 100%? it should provide more performance....
Calin - Friday, November 18, 2011 - link
You're encrypting AES-256, and Anand seem to encryrpt AES-128 in the article you liked to in the Other Tests: TrueCrypt and 7-zip pagetaltamir - Friday, November 18, 2011 - link
Conclusion: "Intel gives much better performance/watt and performance in general; BD gives better performance/dollar"Problem: Watts cost dollars, lots of them in the server space because you need to some some pretty extreme cooling. Also absolute performance per physical space matters a lot because that ALSO costs tons of money.
UberApfel - Sunday, November 20, 2011 - link
A watt-year is about $2.The difference in cost between a X5670 & 6276; $654
On Page 7...
X5670: 74.5 perf / 338 W
6276: 71.2 perf / 363 W
adjusted watt-per-performance for 6276: 363 * (74.5 / 71.2) = 380
difference in power consumption: 42W
If a server manages an average of 50% load over all time; the Xeon's supposed superior power-efficiency would pay for itself after only 31 years.
Of course you're not taking into consideration that this test is pretty much irrelevant to the server market. Additionally, as the author failed to clarify when asked, Anandtech likely didn't use newer compilers which show up to a 100% performance increase in some applications ~ looky; http://www.phoronix.com/scan.php?page=article&...
Thermalzeal - Monday, November 21, 2011 - link
Good job AMD, you had one thing to do, test your product and make sure it beat competitors at the same price, or gave comparable performance for a lower price.Seriously, wtf are you people doing?
UberApfel - Tuesday, November 22, 2011 - link
Idiots like this is exactly why I say the review is biased. How can anyone with the ability to type be able to scan over this review and come to such a conclusion. At least with the confidence to comment.zappb - Tuesday, November 29, 2011 - link
completely agree - some very strange comments along these lines over the last 11 pageszappb - Tuesday, November 29, 2011 - link
posted by ars technica - incredibly tainted in intels favourThe title is enough:
"AMD's Bulldozer server benchmarks are here, and they're a catastrophe"