The Crucial m4 (Micron C400) SSD Review
by Anand Lal Shimpi on March 31, 2011 3:16 AM ESTAnandTech Storage Bench 2011: Much Heavier
I didn't expect to have to debut this so soon, but I've been working on updated benchmarks for 2011. Last year we introduced our AnandTech Storage Bench, a suite of benchmarks that took traces of real OS/application usage and played them back in a repeatable manner. I assembled the traces myself out of frustration with the majority of what we have today in terms of SSD benchmarks.
Although the AnandTech Storage Bench tests did a good job of characterizing SSD performance, they weren't stressful enough. All of the tests performed less than 10GB of reads/writes and typically involved only 4GB of writes specifically. That's not even enough exceed the spare area on most SSDs. Most canned SSD benchmarks don't even come close to writing a single gigabyte of data, but that doesn't mean that simply writing 4GB is acceptable.
Originally I kept the benchmarks short enough that they wouldn't be a burden to run (~30 minutes) but long enough that they were representative of what a power user might do with their system.
Not too long ago I tweeted that I had created what I referred to as the Mother of All SSD Benchmarks (MOASB). Rather than only writing 4GB of data to the drive, this benchmark writes 106.32GB. It's the load you'd put on a drive after nearly two weeks of constant usage. And it takes a *long* time to run.
I'll be sharing the full details of the benchmark in some upcoming SSD articles but here are some details:
1) The MOASB, officially called AnandTech Storage Bench 2011—Heavy Workload, mainly focuses on the times when your I/O activity is the highest. There is a lot of downloading and application installing that happens during the course of this test. My thinking was that it's during application installs, file copies, downloading and multitasking with all of this that you can really notice performance differences between drives.
2) I tried to cover as many bases as possible with the software I incorporated into this test. There's a lot of photo editing in Photoshop, HTML editing in Dreamweaver, web browsing, game playing/level loading (Starcraft II & WoW are both a part of the test) as well as general use stuff (application installing, virus scanning). I included a large amount of email downloading, document creation and editing as well. To top it all off I even use Visual Studio 2008 to build Chromium during the test.
Update: As promised, some more details about our Heavy Workload for 2011.
The test has 2,168,893 read operations and 1,783,447 write operations. The IO breakdown is as follows:
| AnandTech Storage Bench 2011—Heavy Workload IO Breakdown | ||||
| IO Size | % of Total | |||
| 4KB | 28% | |||
| 16KB | 10% | |||
| 32KB | 10% | |||
| 64KB | 4% | |||
Only 42% of all operations are sequential, the rest range from pseudo to fully random (with most falling in the pseudo-random category). Average queue depth is 4.625 IOs, with 59% of operations taking place in an IO queue of 1.
Many of you have asked for a better way to really characterize performance. Simply looking at IOPS doesn't really say much. As a result I'm going to be presenting Storage Bench 2011 data in a slightly different way. We'll have performance represented as Average MB/s, with higher numbers being better. At the same time I'll be reporting how long the SSD was busy while running this test. These disk busy graphs will show you exactly how much time was shaved off by using a faster drive vs. a slower one during the course of this test. Finally, I will also break out performance into reads, writes and combined. The reason I do this is to help balance out the fact that this test is unusually write intensive, which can often hide the benefits of a drive with good read performance.
There's also a new light workload for 2011. This is a far more reasonable, typical every day use case benchmark. Lots of web browsing, photo editing (but with a greater focus on photo consumption), video playback as well as some application installs and gaming. This test isn't nearly as write intensive as the MOASB but it's still multiple times more write intensive than what we were running last year.
As always I don't believe that these two benchmarks alone are enough to characterize the performance of a drive, but hopefully along with the rest of our tests they will help provide a better idea.
The testbed for Storage Bench 2011 has changed as well. We're now using a Sandy Bridge platform with full 6Gbps support for these tests. All of the older tests are still run on our X58 platform.
AnandTech Storage Bench 2011—Heavy Workload
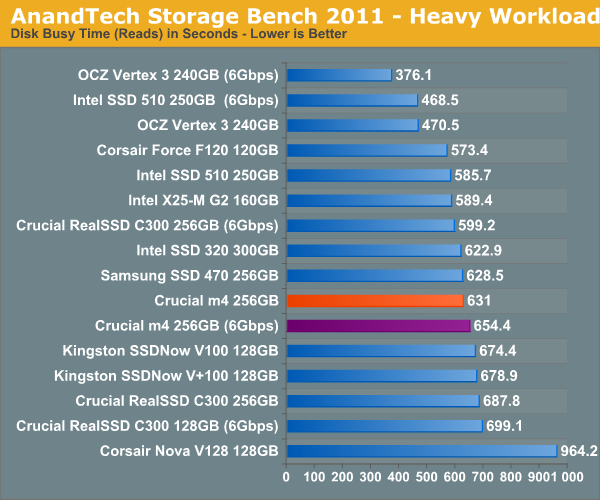
We'll start out by looking at average data rate throughout our new heavy workload test:
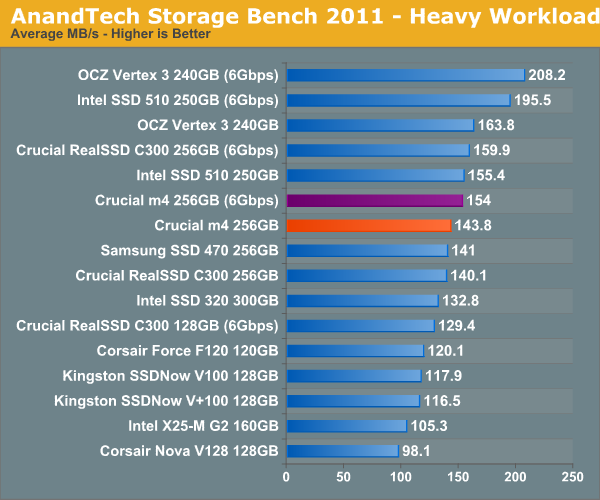
While we saw a pretty significant difference between 3Gbps and 6Gbps interfaces with the Intel 510 and Vertex 3, but the same can't be said about Crucial's m4. There's only a 7% performance improvement seen by using a 6Gbps connector on our Sandy Bridge system. Even more interesting is that performance actually drops a bit compared to the C300. We saw this in some of our synthetic Iometer tests and it's definitely reflected here.
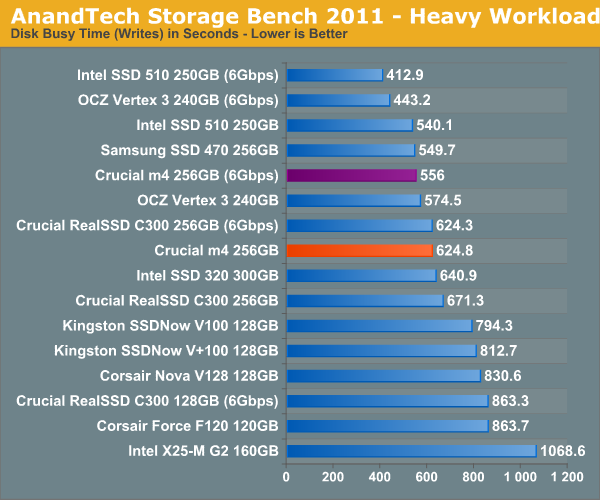
The breakdown of reads vs. writes tells us more of what's going on:
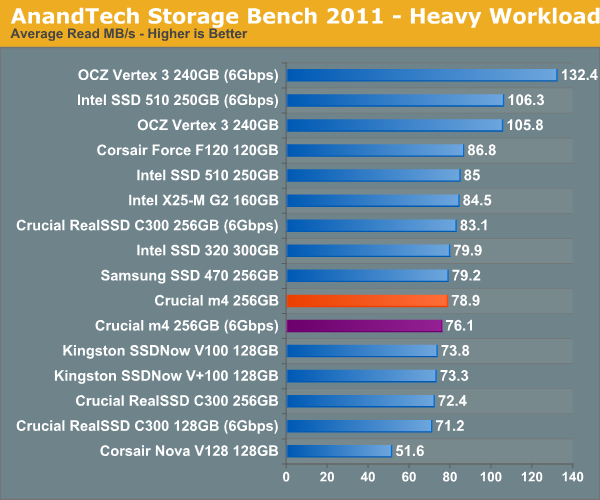
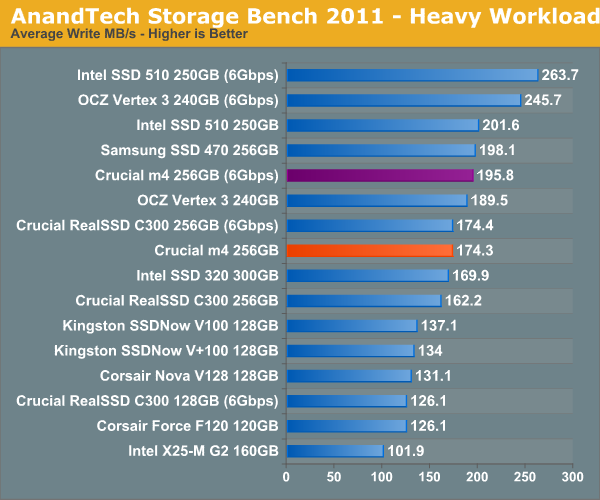
The drop in sequential and random read performance we noticed seems to be at fault for the m4's lower-than-C300 performance. Looking at write speeds we actually see an improvement over the C300:
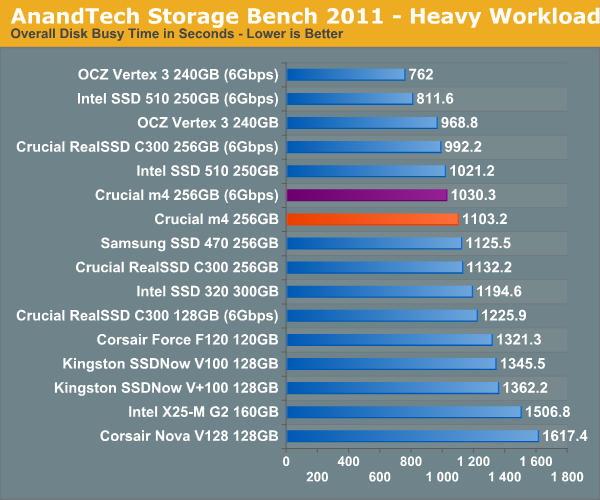
The next three charts just represent the same data, but in a different manner. Instead of looking at average data rate, we're looking at how long the disk was busy for during this entire test. Note that disk busy time excludes any and all idles, this is just how long the SSD was busy doing something:


103 Comments
View All Comments
7Enigma - Friday, April 1, 2011 - link
No. You do not. The TRIM command will either run at a set interval or you can do it manually depending on the drive maker (INTEL for instance has a Toolbox that I use once a week or so), and this will return the drive to near-new performance. It's only OS' and drives that do not support TRIM that a complete format (or another method such as copying a large amount of data to the drive and erasing) would be required for this.eamon - Sunday, April 3, 2011 - link
You don't even need that - windows will issue the trim command automatically after a file delete if a block becomes available. You don't need any special driver or special tool; normal use will trigger trims on win7.danbi - Wednesday, April 6, 2011 - link
The typical "OS drive" is "write rarely, read many times". There might be occasional writes to the OS drive, in form of log files, new drivers etc. You rarely, if ever delete files from the "OS drive". Perhaps only when you uninstall software.How would TRIM (supporting OS) ever help in such scenario?
One thing I miss form the "TRIM performance" is what happens when you overwrite already existing files -- pretty common task, by the way.
Another thing, performance with COW file systems, such as ZFS. These file systems will never overwrite data (except metadata) and most of the time writes will be "sequential".
By the way, another missing performance metric is what each drive considers "sequential write". How much KB data in one I/O operations sequential? Is this common with all drives?
faster - Thursday, March 31, 2011 - link
The egg has the RevoDrive 240 GB for $570. The 3rd gen Intel drive is $614 at 250 GB. The new M4 drive is $599?. Price competition in this price point would warrant a comparison in performance. I would like to see the X2 skew the chart to illustrate performance per dollar invested. I understand that the X2 is a PCIE self contained RAID card, but it is a bootable card making it a hard drive competitor. No matter how you feel about it, it would be an interesting comparison from an economic viewpoint.flexcore - Friday, April 1, 2011 - link
Good review! The problem is there are so many different versions of each drive. They change performance characteristics as the size of the drive changes. (Not even getting into OCZ's recent crimes against consumers)I like what MilwaukeeMike brought up about different types of users and how different drives seem to be suited better for different usage patterns. As a AMD user I would also appreciate a review on how these drives perform on AMD platform vs Intel. Then we have TRIM. This is becoming more and more of the normal operational mode, but not always, and what about in RAID configuration.
WOW, these are not the only questions that I continually have been hearing asked on forums around the web. This is a lot of information and work but, you are a leader in SSD reviews. I applaud your efforts ANAND and want to thank you for doing the work you do. I think you are heading in the right direction with your own storage benchmarks, but thats only part of what consumers need. More real world usage to be able discern the actual advances from each new generatin of drive is important also. I look forward to reading more of your insights into where we are and where we are heading with SSD technology.
7Enigma - Friday, April 1, 2011 - link
What we need is some understanding of what is really needed by a SSD. We have all these different benchmarks that are combining IMO way too many tasks at once that a human just cannot perform. Yes it's great to tease out a pretty graph, but what I think most of us want to really see is what is the real-world difference.Things like the Gaming benchmark where there is practically NO difference between current and last-gen drives (hell even the G2 is pretty close) are very important to me so I don't get the upgrade bug for something I really have no major benefit from. Vantage as well.
Anand's said it for a while but there is a huge difference between SSD and mechanical drive, once you upgrade to SSD, however, the improvements for most human workloads (ie non benchmarks) is slim.
I'd love a mini article that would track 4-5 different people's usage models: gamer, web surfer/facebook/iTunes average joe, encoder, and whatever other major "type" of person that frequents Anandtech (it should be biased towards the readership IMO), and then create a benchmark based on that.
We don't need 24 programs opening simultaneously while downloading a torrent and doing a virus scan. What we do need to see is if there is any tangible benefit to 6Gbps SATA over 3 in normal daily use and G1 to Vertex3. If not the numbers are great and if buying a SSD for the first time or building a system OK, but the need to upgrade from an existing SSD is just not there.
Great article btw!
X-Nemesis - Friday, April 1, 2011 - link
This is what I think as well...it does not seem like there is really any real world benefit to upgrade an older generation SSD to the new 6Gbps offerings. The only reason to upgrade would be size at a much cheaper price point.Nicolas Pillot - Friday, April 1, 2011 - link
I'm quite new to the field, and looking at the charts i have a plainly simple (but stupid ?) question : how is it that the read speed are lower than the write speed ?!7Enigma - Friday, April 1, 2011 - link
Make sure you are comparing apples to apples. Sequential read/write will be much higher then random read/write so if you are comparing a random read to a sequential write you will see a discrepancy.iwodo - Friday, April 1, 2011 - link
Just thought Anand you should compare all the 40 - 80GB Range SSD. Since it is very likely that we buy the lower capacity drive then the expensive but also slightly faster SSD.