The Crucial m4 (Micron C400) SSD Review
by Anand Lal Shimpi on March 31, 2011 3:16 AM ESTAnandTech Storage Bench 2011: Much Heavier
I didn't expect to have to debut this so soon, but I've been working on updated benchmarks for 2011. Last year we introduced our AnandTech Storage Bench, a suite of benchmarks that took traces of real OS/application usage and played them back in a repeatable manner. I assembled the traces myself out of frustration with the majority of what we have today in terms of SSD benchmarks.
Although the AnandTech Storage Bench tests did a good job of characterizing SSD performance, they weren't stressful enough. All of the tests performed less than 10GB of reads/writes and typically involved only 4GB of writes specifically. That's not even enough exceed the spare area on most SSDs. Most canned SSD benchmarks don't even come close to writing a single gigabyte of data, but that doesn't mean that simply writing 4GB is acceptable.
Originally I kept the benchmarks short enough that they wouldn't be a burden to run (~30 minutes) but long enough that they were representative of what a power user might do with their system.
Not too long ago I tweeted that I had created what I referred to as the Mother of All SSD Benchmarks (MOASB). Rather than only writing 4GB of data to the drive, this benchmark writes 106.32GB. It's the load you'd put on a drive after nearly two weeks of constant usage. And it takes a *long* time to run.
I'll be sharing the full details of the benchmark in some upcoming SSD articles but here are some details:
1) The MOASB, officially called AnandTech Storage Bench 2011—Heavy Workload, mainly focuses on the times when your I/O activity is the highest. There is a lot of downloading and application installing that happens during the course of this test. My thinking was that it's during application installs, file copies, downloading and multitasking with all of this that you can really notice performance differences between drives.
2) I tried to cover as many bases as possible with the software I incorporated into this test. There's a lot of photo editing in Photoshop, HTML editing in Dreamweaver, web browsing, game playing/level loading (Starcraft II & WoW are both a part of the test) as well as general use stuff (application installing, virus scanning). I included a large amount of email downloading, document creation and editing as well. To top it all off I even use Visual Studio 2008 to build Chromium during the test.
Update: As promised, some more details about our Heavy Workload for 2011.
The test has 2,168,893 read operations and 1,783,447 write operations. The IO breakdown is as follows:
| AnandTech Storage Bench 2011—Heavy Workload IO Breakdown | ||||
| IO Size | % of Total | |||
| 4KB | 28% | |||
| 16KB | 10% | |||
| 32KB | 10% | |||
| 64KB | 4% | |||
Only 42% of all operations are sequential, the rest range from pseudo to fully random (with most falling in the pseudo-random category). Average queue depth is 4.625 IOs, with 59% of operations taking place in an IO queue of 1.
Many of you have asked for a better way to really characterize performance. Simply looking at IOPS doesn't really say much. As a result I'm going to be presenting Storage Bench 2011 data in a slightly different way. We'll have performance represented as Average MB/s, with higher numbers being better. At the same time I'll be reporting how long the SSD was busy while running this test. These disk busy graphs will show you exactly how much time was shaved off by using a faster drive vs. a slower one during the course of this test. Finally, I will also break out performance into reads, writes and combined. The reason I do this is to help balance out the fact that this test is unusually write intensive, which can often hide the benefits of a drive with good read performance.
There's also a new light workload for 2011. This is a far more reasonable, typical every day use case benchmark. Lots of web browsing, photo editing (but with a greater focus on photo consumption), video playback as well as some application installs and gaming. This test isn't nearly as write intensive as the MOASB but it's still multiple times more write intensive than what we were running last year.
As always I don't believe that these two benchmarks alone are enough to characterize the performance of a drive, but hopefully along with the rest of our tests they will help provide a better idea.
The testbed for Storage Bench 2011 has changed as well. We're now using a Sandy Bridge platform with full 6Gbps support for these tests. All of the older tests are still run on our X58 platform.
AnandTech Storage Bench 2011—Heavy Workload
We'll start out by looking at average data rate throughout our new heavy workload test:
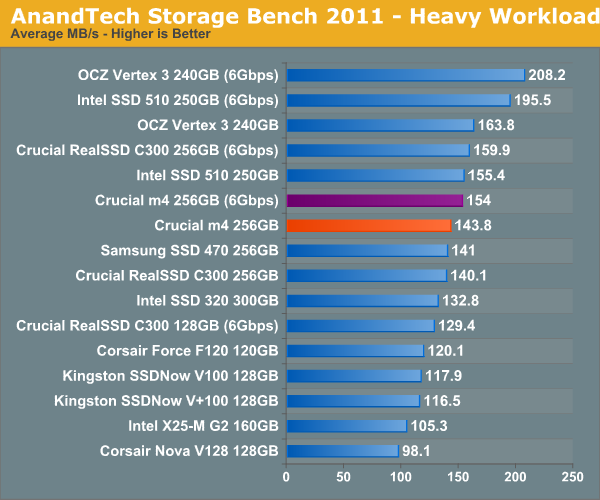
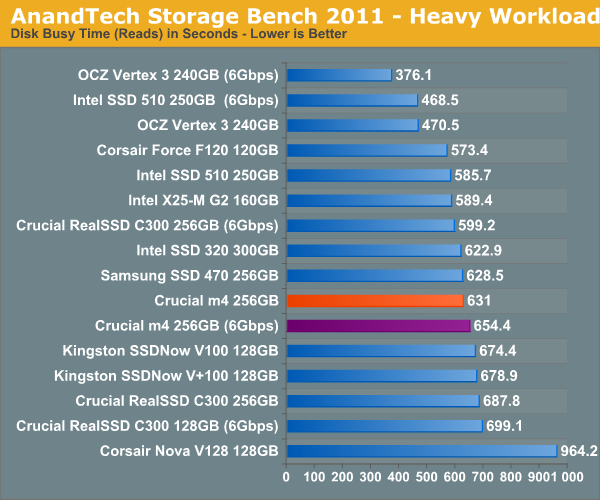
While we saw a pretty significant difference between 3Gbps and 6Gbps interfaces with the Intel 510 and Vertex 3, but the same can't be said about Crucial's m4. There's only a 7% performance improvement seen by using a 6Gbps connector on our Sandy Bridge system. Even more interesting is that performance actually drops a bit compared to the C300. We saw this in some of our synthetic Iometer tests and it's definitely reflected here.
The breakdown of reads vs. writes tells us more of what's going on:
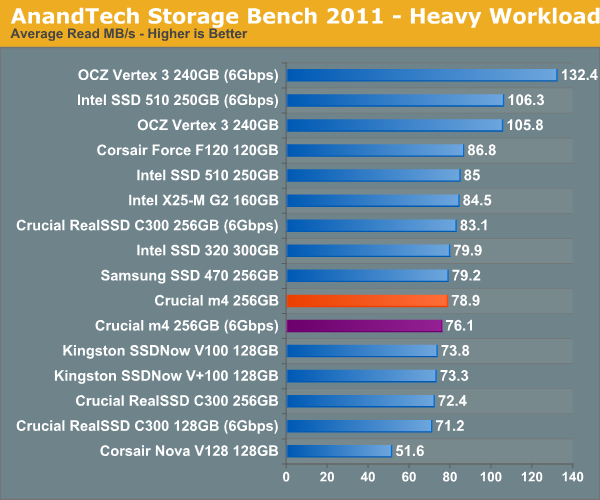
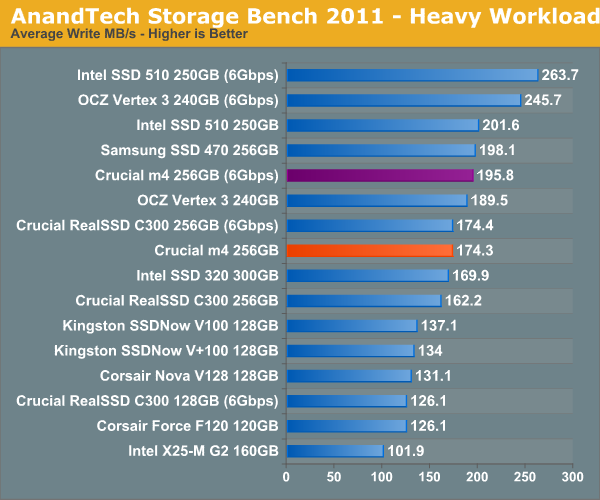
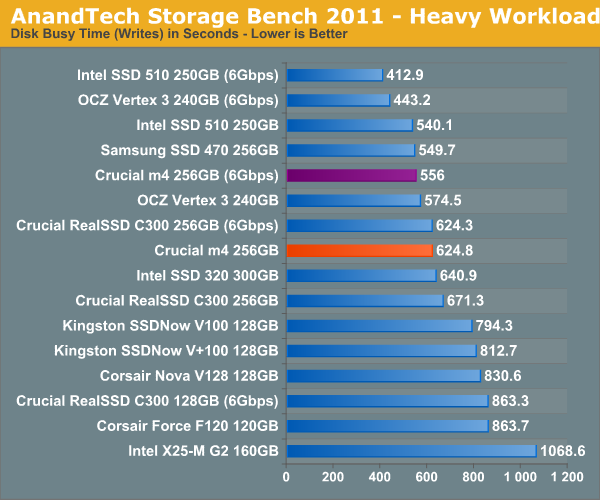
The drop in sequential and random read performance we noticed seems to be at fault for the m4's lower-than-C300 performance. Looking at write speeds we actually see an improvement over the C300:
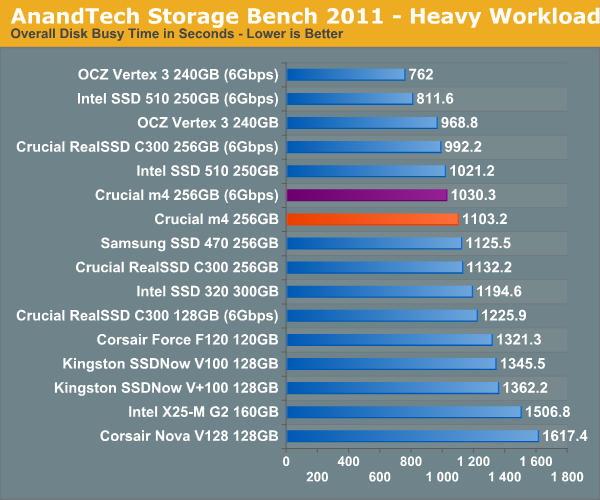
The next three charts just represent the same data, but in a different manner. Instead of looking at average data rate, we're looking at how long the disk was busy for during this entire test. Note that disk busy time excludes any and all idles, this is just how long the SSD was busy doing something:


103 Comments
View All Comments
dingo99 - Thursday, March 31, 2011 - link
While it's great that you test overall drive performance before and after a manually-triggered TRIM, it's unfortunate that you do not test real-world TRIM performance amidst other drive operations. You've mentioned often that Crucial drives like C300 need TRIM, but you've missed the fact that C300 is a very poor performer *during* the TRIM process. If you try to use a C300-based system on Win7 while TRIM operations are being performed (Windows system image backup from SSD to HD, for example) you will note significant stuttering due to the drive locking up while processing its TRIMs. Disable Win7 TRIM, and all the stuttering goes away. Sadly, the limited TRIM tests you perform now do not tell the whole story about how the drives will perform in day-to-day usage.Anand Lal Shimpi - Thursday, March 31, 2011 - link
I have noticed that Crucial's drives tend to be slower at TRIMing than the competition. I suspect this is a side effect of very delayed garbage collection and an attempt to aggressively clean blocks once the controller receives a TRIM instruction.I haven't seen this as much in light usage of either the C300 or m4 but it has definitely cropped up in our testing, especially during those full drive TRIM passes.
jinino - Thursday, March 31, 2011 - link
Is it possible to include MB with AMD's 890 series chipset to test SATA III performance?Thanks
whatwhatwhat2011 - Thursday, March 31, 2011 - link
I continue to be frustrated by the lack of actual, task-oriented, real world benchmarking for SSDs. That is to say, tests that execute common tasks (like booting, loading applications, doing disk intensive desktop tasks like audio/video/photo editing) and reporting exactly how long those tasks took (in seconds) using different disks.This is really what we care about when we buy SSDs. Sequential read and write numbers are near irrelevant in real world use. The same could be said for IOPs measurements, which have so many variables involved. I understand that your storage bench is supposed to satisfy this need, but I don't think that it does. The numbers it returns are still abstract values that, in effect, don't really communicate to the reader what the actual performance difference is.
Bringing it home, my point is that while we all understand that going from an HDD system drive to an SSD results in an enormous performance improvement, we really have no idea how much better a SF-2200 based Vertex 3 is than an Indilinx Vertex 1 is in real world use. Sure, we understand that it's tons faster in the benches, but if that translates to application loading times that are only 1 second faster, who really cares to make that upgrade?
In particular, I'm thinking of Sandforce drives. They really blow the doors off benchmarking suites, but how does that translate to real world performance? Most of the disk intensive desktop tasks out there involve editing photos and videos that are generally speaking already highly compressed (ie, incompressible).
Anand, you are a true leader in SSD performance analysis. I hope that you'll take the lead once again and put an end to this practice of reporting benchmark numbers that - while exciting to compare - are virtually useless when it comes to making buying decisions.
In the interest of being positive and helpful, here are a few tasks that I'd loved to see benched and compared going forward (especially between high end HDDs, second gen SSDs and third gen SSDs).
1. Boot times (obviously you'd have to standardize the mobo for useful results).
2. Application load times for "heavy" apps like Photoshop, After Effects, Maya, AutoCAD, etc
3. Load times for large Lightroom 3 catalogs using RAW files (which are generally incompressible) and large video editing project files (which include a variety of read types) using the various AVC-flavored acquisition codecs out there.
4. BIG ONE HERE: the real world performance delta for using SSDs as cache drives for content creation apps that deal mostly with incompressible data (like Lightroom and Premiere).
Thanks again for the great work. And I apologize for the typos. Day job's a-callin'.
MilwaukeeMike - Thursday, March 31, 2011 - link
I think part of the reason you don't see much of this is the difficulty in standardizing it. You’d like to see AutoCAD, but I’d like to see visual studio or RSA. I have seen game loading screens in reviews, and I’d like to see that again. Especially since you don’t really know how much data is being loaded. Will a game level load in 5 seconds vs 25 in a standard HD, or is it more like 15 vs 25? I’d also prefer to see a Veliciraptor on the graph because I own one, but that’s just getting picky. However, I’m sure not going to buy a SSD without knowing this stuff.whatwhatwhat2011 - Thursday, March 31, 2011 - link
That's a very valid point, but I don't see much in the way of even an effort in this regard. I certainly wouldn't complain if the application loading tests including a bunch of software that I never use just so long as that software has similar loading characteristics and times as the software I do use. Or anything, really, that gives me some idea of the actual difference in user experience.I have an ugly hunch that there isn't really much (or any) difference between a first gen and third gen SSD in terms of the actual user experience. My personal experience has more or less confirmed this, but that's just anecdotal. These benchmark numbers, as it is, don't tell us much about what is going on with the user's experience.
They do, however, get people excited about buying new SSDs every year. They're hundreds of megabytes per second faster! And I love megabytes.
Chloiber - Friday, April 1, 2011 - link
I do agree. Most SSD tests still lack these kind of tests.On what should I base my decision when buying an SSD? As the AnandStorage Benches show, the results can be completely different (just compare the new suite (which isn't "better", it's just "different") with the old one! Completely different results! And it's still just a benchmark where we don't actually know what has been benched. Yes, Anand provides some numbers, but it's not transparent enough. It's still ONE scenario.
I'd also like to see more simple benchmarks. Sit behind your computer and use a stop watch. Yes, it's more work than using simple tools, but the result is worth WAY more than "YABT" (yet another benchmark tool).
Well yes. Maybe the results are very close. But that's exactly what I want to know. I am very sorry, but right now, I only see synthetic benchmarks in these tests which can't tell me anything.
- Unzipping
- Copying
- Installing
- Loading times of applications (even multiple apps at once)
That's the kind of things I care about. And a trace benchmark is nice, but there is still a layer of abstraction that I just do not want.
whatwhatwhat2011 - Friday, April 1, 2011 - link
It's really gratifying to hear other users sharing my thoughts! I have a hunch we're onto something here.Anand, I hate to sound harsh - as you've clearly put a ton of work into this - but your storage bench is really a step in the wrong direction. Yes, it consists of real world tasks and produces highly replicable results.
But the actual test pattern itself is simply not realistic. Only a small percentage of users ever find themselves doing tasks like that, and even those power users only are capable of producing workloads like this everyone once in awhile (when they're highly, highly caffeinated, I would suppose).
Even more damning, the values it returns are not helpful when making buying decisions. So the Vertex 3 completes the heavy bench some 4-5 minutes ahead of the Crucial m4. What does that actually mean in terms of my user experience?
See, the core of the issue here is really why people buy SSDs. Contrary to the marketing justification, I don't think anyone buys SSDs for productivity gains (although that might be how they justify the purchase to themselves as well).
So what are you really getting with an SSD? Confidence and responsiveness. The sort of confidence that comes with immediate responsiveness. Much like how a good sports car will respond immediately to every single touch of the peddles or wheel, we expect a badass computer to respond immediately to our inputs. Until SSDs came along, this simply wasn't a reality.
So the question really is: is one SSD going to make my computer faster, smoother and more responsive than another?
seapeople - Friday, April 1, 2011 - link
How many times must Anand answer this question. Here's your answer:Question: What's the difference between all these SSD's and how they boot/load application X?
Answer: For every SSD from x25m-g2 on THERE IS VERY LITTLE DIFFERENCE.
Anand could spend a lot of time benchmarking how long it takes to start up Photoshop or boot up Windows 7 for these SSD's, but then we'd just get a lot of graphs that vary from 7 seconds to 9 seconds, or 25 seconds to 28 seconds. Or you could skew the graphs with a mechanical hard drive which would be 2-5x the loading time.
In short, the synthetic (or even real-life) torture tests that Anand shows here are the only tests which would show a large difference between these drives, and for everything else you keep asking about there would be very little difference. This is why it sucks that SSD performance is still increasing faster than price is dropping; SSD's are really fast enough to beat hard drives at anything, so the only important factor for most real world situations is the price and how much storage capacity you can live with.
whatwhatwhat2011 - Friday, April 1, 2011 - link
I'm not sure that I understand your indignation. If useful, effective real world benchmarks would demonstrate little difference between SSDs, how is that a waste of anyone's time? If anything, that is exactly the information that both consumers and technologists need.Consumers would be able to make better buying decisions, gauging the real-world benefits (or not) of upgrading from one SSD to another, later generation SSD.
Manufacturers and technologists would benefit from having to confront that fact that clearly performance bottle necks exist elsewhere in the system - either in the hardware I/O subsystems, or in software itself that is still designed to respond to HDD levels of latency. If consumers refused to upgrade from one SSD to another, based upon useful test data that revealed this diminishing real-world benefit, that would also help motivate manufacturers to move on price, instead of focusing on MORE MEGABYTES!
This charade that is currently going on - in which artificial benchmarks and torture tests are being used to exaggerate the difference between drives - certainly makes for exciting reading, but it does little to inform anyone.
Anand is a leader in this subject matter. I post here as opposed to other sites that are guilty of the same because I have a hunch that only he has the resources and enthusiasm necessary to tackle this issue.