The Intel SSD 510 Review
by Anand Lal Shimpi on March 2, 2011 1:23 AM EST- Posted in
- IT Computing
- Storage
- SSDs
- Intel
- Intel SSD 510
Random Read/Write Speed
The four corners of SSD performance are as follows: random read, random write, sequential read and sequential write speed. Random accesses are generally small in size, while sequential accesses tend to be larger and thus we have the four Iometer tests we use in all of our reviews.
Our first test writes 4KB in a completely random pattern over an 8GB space of the drive to simulate the sort of random access that you'd see on an OS drive (even this is more stressful than a normal desktop user would see). I perform three concurrent IOs and run the test for 3 minutes. The results reported are in average MB/s over the entire time. We use both standard pseudo randomly generated data for each write as well as fully random data to show you both the maximum and minimum performance offered by SandForce based drives in these tests. The average performance of SF drives will likely be somewhere in between the two values for each drive you see in the graphs. For an understanding of why this matters, read our original SandForce article.
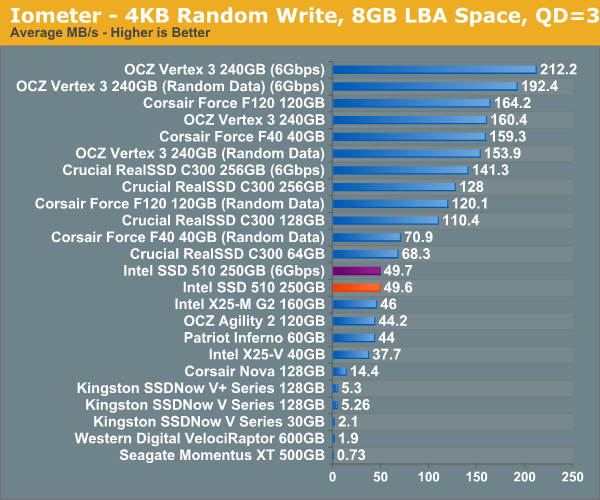
It's a bit unfortunate for Intel that we happen to start our performance analysis with a 4KB random write test in Iometer. The 510's random write performance is only marginally better than the X25-M G2 at 49.7MB/s. The RealSSD C300 is faster, not to mention the SF-1200 based Corsair Force F120 and the SF-2200 based OCZ Vertex 3.
Although not depicted here, max write latency is significantly reduced compared to the X25-M G2. While the G2 would occasionally hit a ~900ms write operation, the 510 keeps the worst case latency to below 400ms. The Vertex 3 by comparison has a max write latency of anywhere from 60ms - 350ms depending on the type of data being written.
Many of you have asked for random write performance at higher queue depths. What I have below is our 4KB random write test performed at a queue depth of 32 instead of 3. While the vast majority of desktop usage models experience queue depths of 0 - 5, higher depths are possible in heavy I/O (and multi-user) workloads:
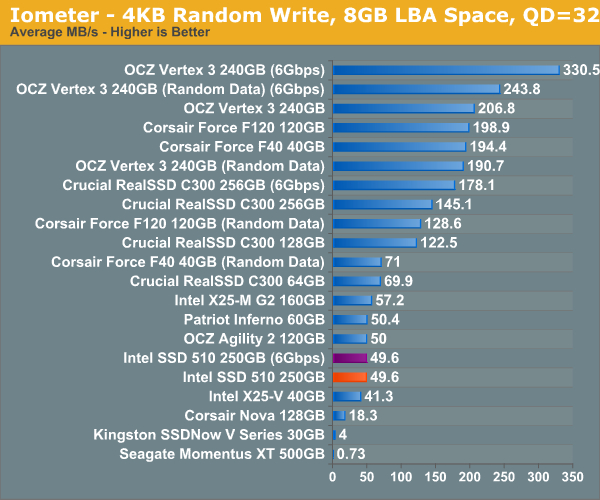
While the X25-M G2 scaled with queue depth in our random write test, the 510 does not. It looks like 50MB/s is the absolute highest performance we'll see for constrained 4KB random writes. Note that these numbers are for 4KB aligned transfers, performance actually drops down to ~40MB/s if you perform sector aligned transfers (e.g. performance under Windows XP).
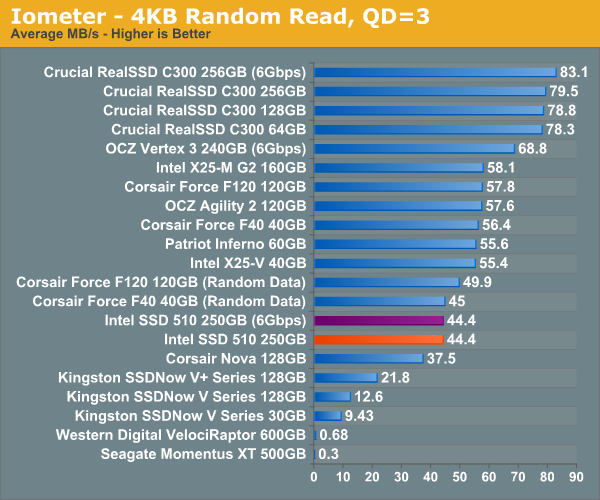
Random read performance is just as disappointing. The X25-M G2 took random read performance seriously but the 510 is less than 20% faster than the Indilinx based Corsair Nova. When I said the Intel SSD 510's random performance is decidedly last-generation, I meant it.


128 Comments
View All Comments
masterkritiker - Wednesday, March 2, 2011 - link
When will we be able to buy $100+ SSDs @ 1TB capacity?gammaray - Wednesday, March 2, 2011 - link
nevertno - Thursday, March 3, 2011 - link
+1Nihility - Thursday, March 3, 2011 - link
At least 4 years.ionis - Wednesday, March 2, 2011 - link
It would be nice if some HDDs were also included in workload benches. They were in the random read/write benches so I don't get why they were left out of the other ones.dagamer34 - Wednesday, March 2, 2011 - link
HDDs aren't included because they'd throw off the scale pretty horribly. The number labeling the performance would be larger than the bar itself compared to all the other SSDs out there.ionis - Thursday, March 3, 2011 - link
I find that hard to believe, considering they were included in the random read/write graphs at 1/100 or less of the performance of some of the SSDs and the charts weren't scaled horribly.In the sequential reads/writes, they performed at 25%-80% which doesn't through the scale off much at all.
The heavy workload looked to involve a lot of sequential access (installs and downloads). So again, I don't see why they weren't included.
There are also other comments asking for more HDDs in the benches. For people like myself, who didn't start following storage benchmarks until SSDs came out, it's hard to tell what the performance gain is.
ionis - Thursday, March 3, 2011 - link
I find that hard to believe, considering they were included in the random read/write graphs at 1/100 or less of the performance of some of the SSDs and the charts weren't scaled horribly.In the sequential reads/writes, they performed at 25%-80% which doesn't throw the scale off much at all.
The heavy workload looked to involve a lot of sequential access (installs and downloads). So again, I don't see why they weren't included.
There are also other comments asking for more HDDs in the benches. For people like myself, who didn't start following storage benchmarks until SSDs came out, it's hard to tell what the performance gain is.
(sorry if double post, comment didn't seem to show up 1st time)
mateus1987 - Wednesday, March 2, 2011 - link
now you know.http://nzealander.blog.com/files/2011/03/6661.jpg
mateus1987 - Wednesday, March 2, 2011 - link
the satanic Apple logo.http://nzealander.blog.com/files/2011/03/6661.jpg