Intel Core i9-13900K and i5-13600K Review: Raptor Lake Brings More Bite
by Gavin Bonshor on October 20, 2022 9:00 AM ESTGaming Performance: 1080p
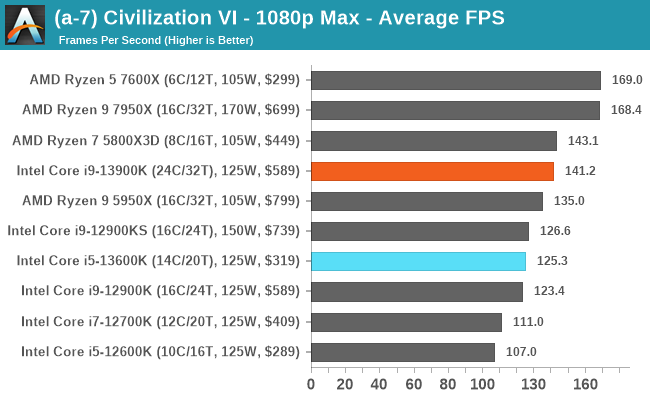
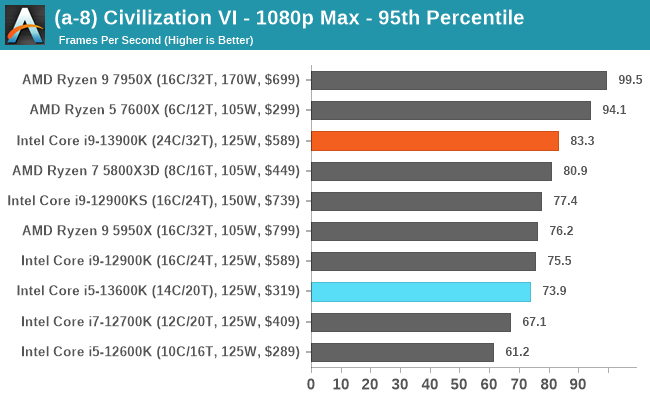
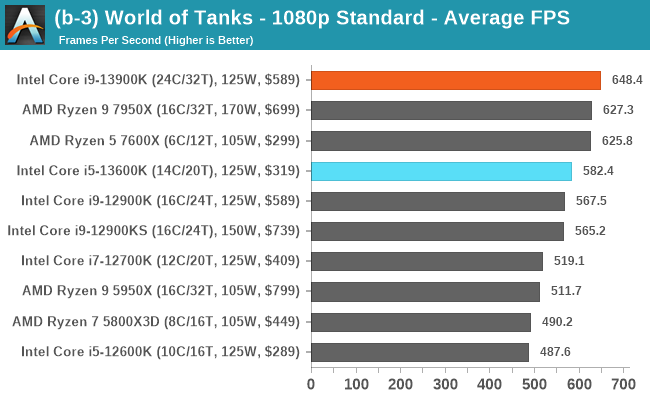
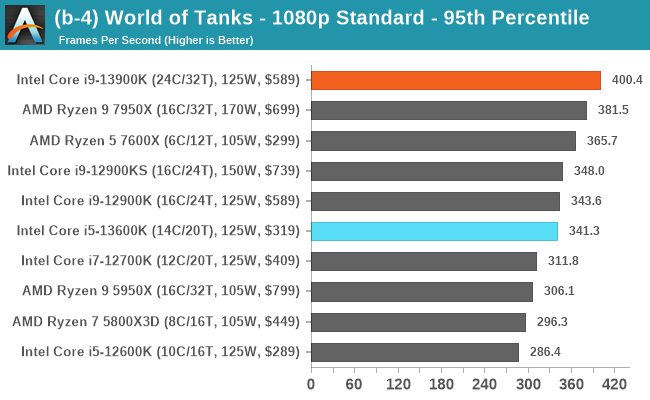
Moving along, here's a look at a more balanced gaming scenario, running games at 1080p with maximum image quality.
Civilization VI
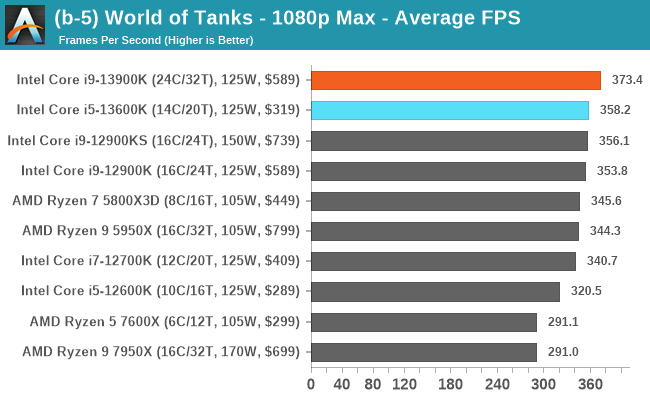
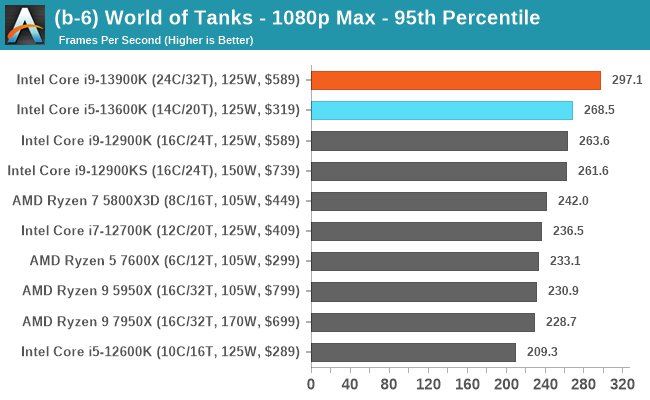
World of Tanks
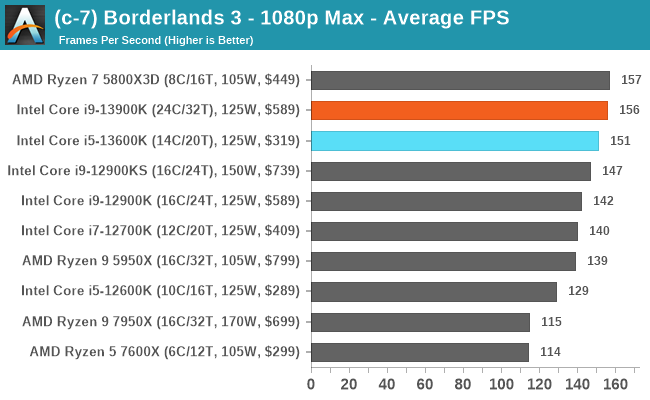
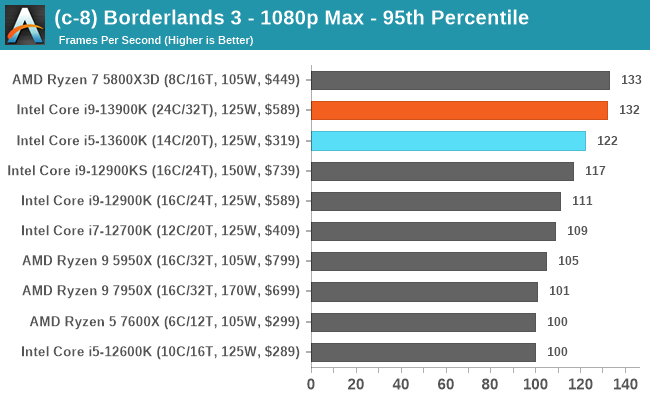
Borderlands 3
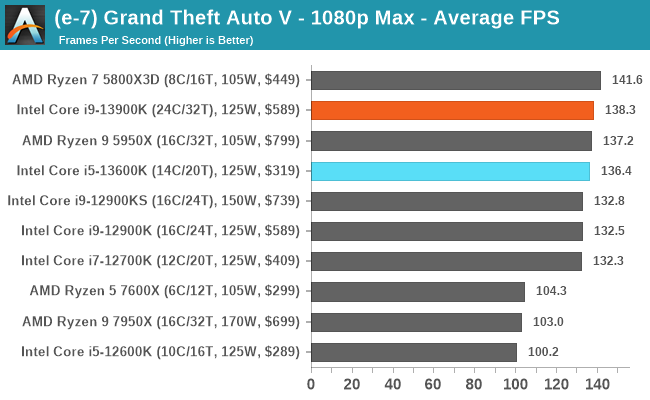
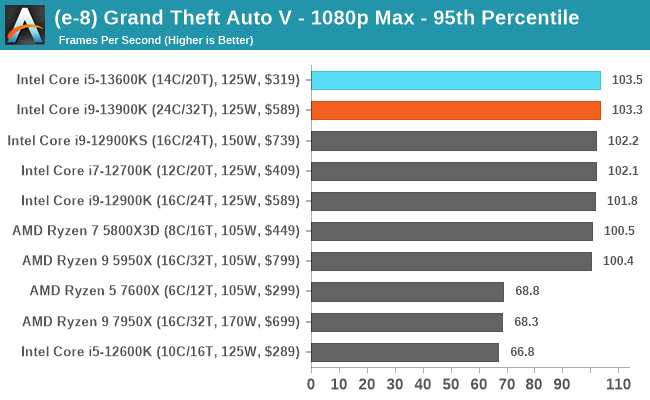
Grand Theft Auto V
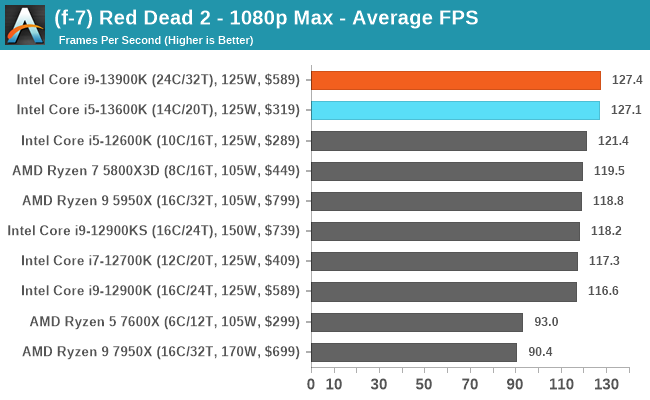
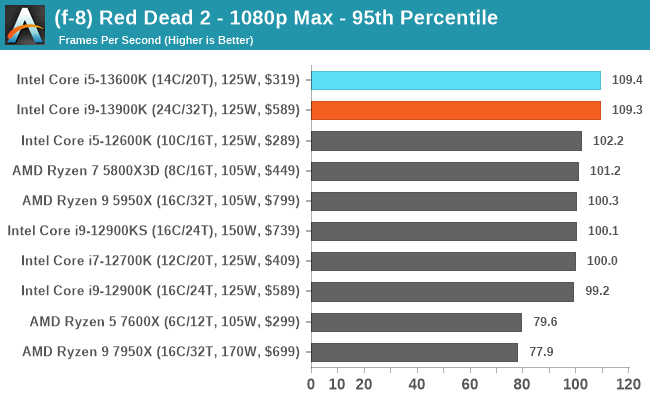
Red Dead Redemption 2
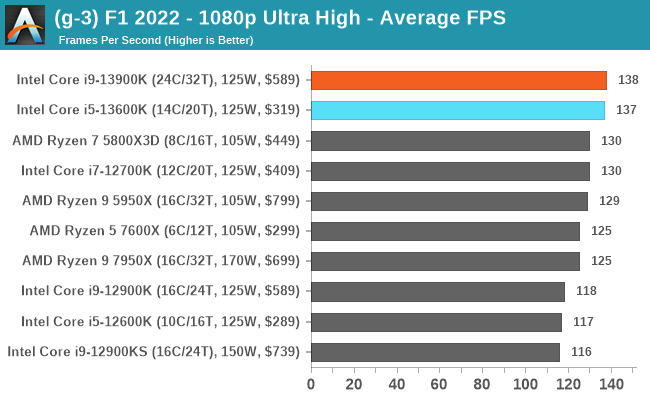
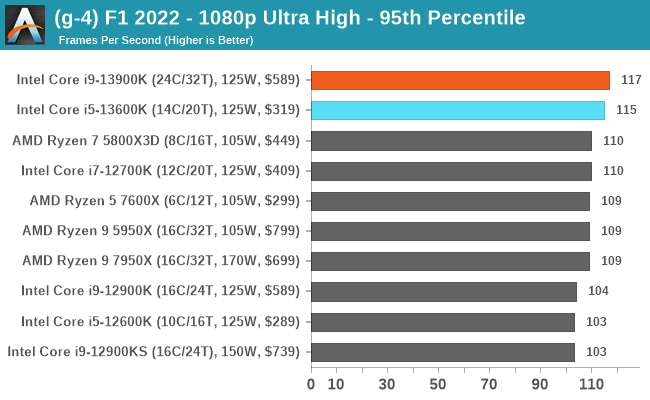
F1 2022
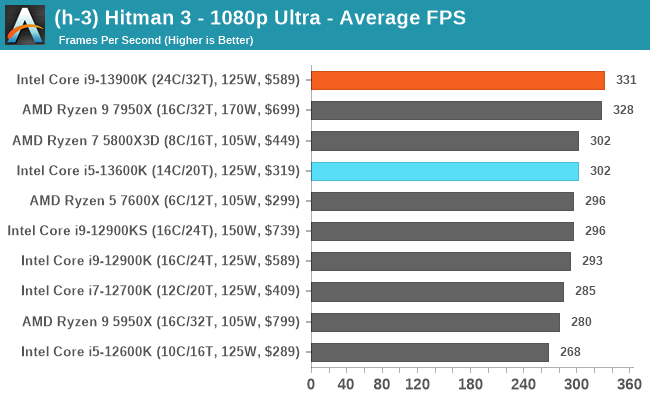
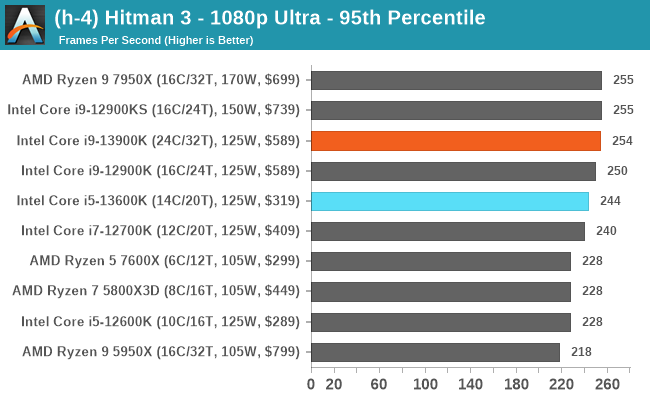
Hitman 3
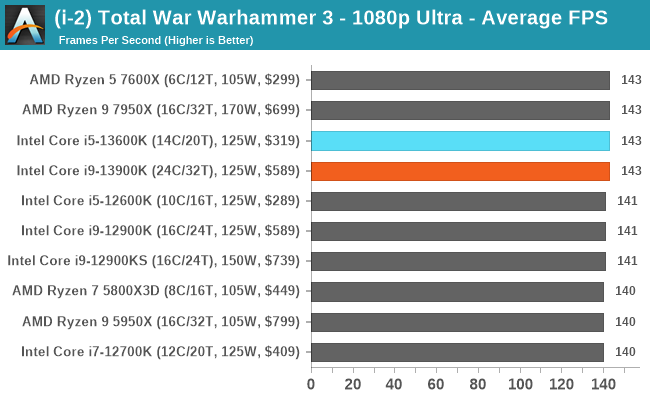
Total War: Warhammer 3
Cyberpunk 2077
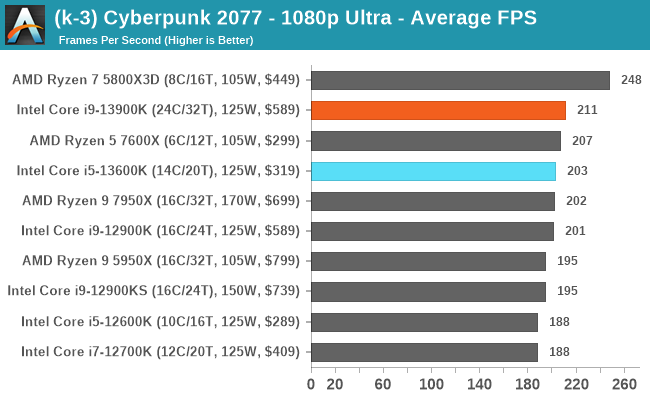
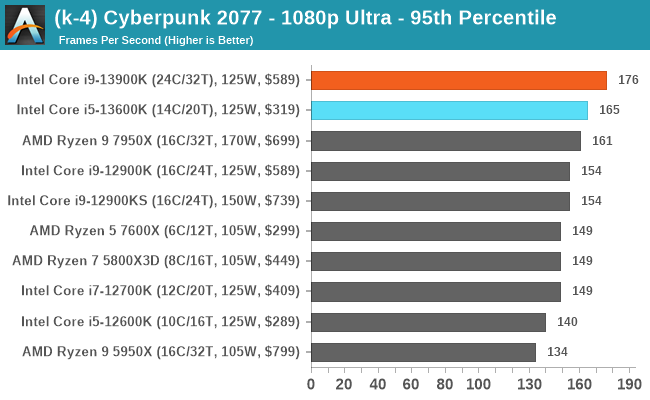
The 1920 x 1080p resolution is still popular with users (even I still game at 1080p), and looking at our results with our AMD Radeon RX 6950 XT graphics card, the 13th Gen Core series processors are highly competitive. In some cases, AMD's Ryzen 7 5800X3D with 96 MB of 3D V-Cache makes for a great value in gaming, even if it's not really on par with Ryzen 7000 or Intel's 13th Gen in compute performance.
There are certainly trade-offs depending on the title on whether the game favors AMD or Intel, but the key thing to take is, things are competitive, especially at 1080p gaming.


169 Comments
View All Comments
Pjotr - Thursday, October 20, 2022 - link
Closing thoughts typos: Ryzen 580X3D and Ryzen 700. ReplyRyan Smith - Thursday, October 20, 2022 - link
Thanks! Replymode_13h - Thursday, October 20, 2022 - link
Thanks for the review!Could you please add the aggregates, in the SPEC 2017 scores? There's usually a summary chart that has an average of the individual benchmarks, and then it often has the equivalent scores from more CPUs/configurations than the individual test graphs contain. For example, see the Alder Lake review:
https://www.anandtech.com/show/17047/the-intel-12t... Reply
Arbie - Thursday, October 20, 2022 - link
TechSpot / Hardware Unboxed show that to complete a Blender job the 13900K takes 50% more total system energy than does the 7950X. Intel completing a Cinebench job takes 70% more energy. Meaning heat in the room. And that's with the Intel chip thermal throttling instantly on even the best cooling.Looking at AT's "Power" charts here, which list the Intel chip as "125W" and AMD as "170W", many readers will get EXACTLY THE OPPOSITE impression.
Sure, you mention the difficulties in comparing TDPs etc, and compare this gen Intel to last gen etc but none of that "un-obscures" the totally erroneous Intel vs AMD picture you've conveyed.
ESPECIALLY when your conclusion says they're "very close in performance" !! BAD JOB, AT. The worst I've seen here in a very long time. Incomprehensibly bad. Reply
gezafisch - Thursday, October 20, 2022 - link
Cope harder - watch Der8auer's video showing that the 13900k can beat any chip at efficiency with the right settings - https://youtu.be/H4Bm0Wr6OEQ ReplyRyan Smith - Thursday, October 20, 2022 - link
We go into the subject of power consumption at multiple points and with multiple graphs, including outlining the 13900K's high peak power consumption in the conclusion.https://images.anandtech.com/graphs/graph17601/130...
Otherwise, the only place you see 125W and 170W are in the specification tables. And those values are the official specifications for those chips. Reply
boeush - Thursday, October 20, 2022 - link
Not true. You have those insanely misleading "TDP" labels on every CPU in the legend of every performance comparison chart. This paints a very misleading picture of "competitive" performance, whereas performance at iso-power (e.g. normalized per watt, based on total system power consumption measured at the outlet) would be much more enlightening. Replyboeush - Thursday, October 20, 2022 - link
*per watt-hour (not per watt)[summed over the duration of the benchmark run] Reply
dgingeri - Thursday, October 20, 2022 - link
Is it just me, or does the L1 cache arrangement seem a bit odd? 48k data and 32k instruction for the P cores and 32k data and 64k instruction on the e-cores. Seems a bit odd to me. ReplyOtritus - Thursday, October 20, 2022 - link
Golden/Raptor Cove has a micro-op cache for instructions. 4096 micro-ops is about equal to 16Kb of instruction cache, which is effectively 48Kb-D + 48Kb-I. I don’t remember whether Gracemont has a micro-op cache. However, it doesn’t have hyperthreading, so maybe it just needs less data cache per core. Reply