Intel Core i9-13900K and i5-13600K Review: Raptor Lake Brings More Bite
by Gavin Bonshor on October 20, 2022 9:00 AM ESTCPU Benchmark Performance: Rendering And Encoding
Rendering tests, compared to others, are often a little more simple to digest and automate. All the tests put out some sort of score or time, usually in an obtainable way that makes it fairly easy to extract. These tests are some of the most strenuous in our list, due to the highly threaded nature of rendering and ray-tracing, and can draw a lot of power.
If a system is not properly configured to deal with the thermal requirements of the processor, the rendering benchmarks are where it would show most easily as the frequency drops over a sustained period of time. Most benchmarks in this case are re-run several times, and the key to this is having an appropriate idle/wait time between benchmarks to allow for temperatures to normalize from the last test.
One of the interesting elements of modern processors is encoding performance. This covers two main areas: encryption/decryption for secure data transfer, and video transcoding from one video format to another.
In the encrypt/decrypt scenario, how data is transferred and by what mechanism is pertinent to on-the-fly encryption of sensitive data - a process by which more modern devices are leaning to for software security.
We are using DDR5 memory on the Core i9-13900K, the Core i5-13600K, the Ryzen 9 7950X, and Ryzen 5 7600X, as well as Intel's 12th Gen (Alder Lake) processors at the following settings:
- DDR5-5600B CL46 - Intel 13th Gen
- DDR5-5200 CL44 - Ryzen 7000
- DDR5-4800 (B) CL40 - Intel 12th Gen
All other CPUs such as Ryzen 5000 and 3000 were tested at the relevant JEDEC settings as per the processor's individual memory support with DDR4.
Rendering
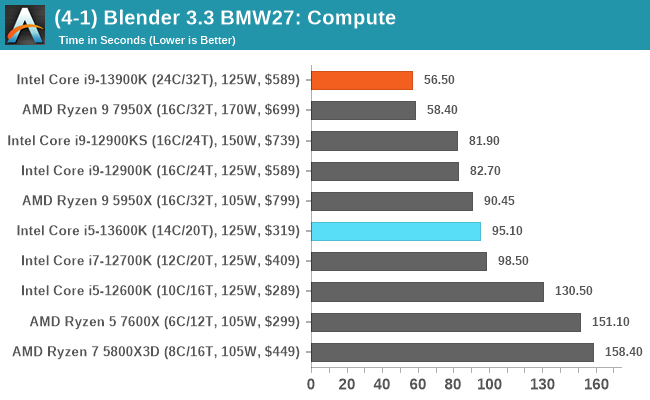

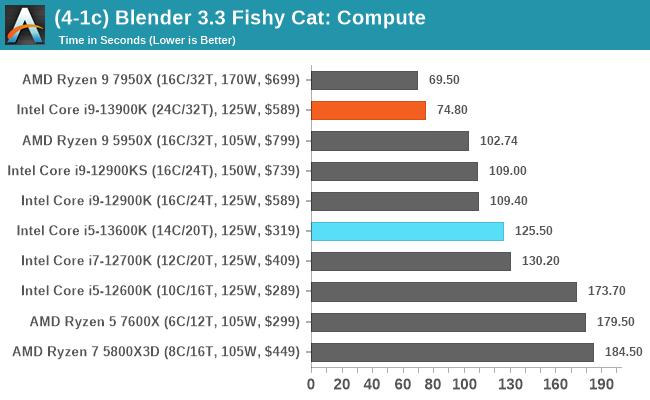
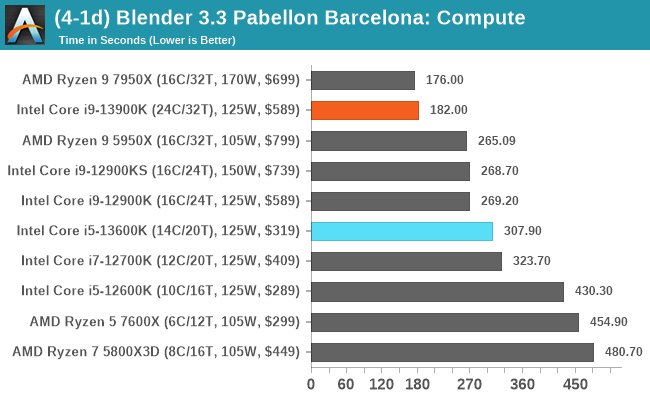
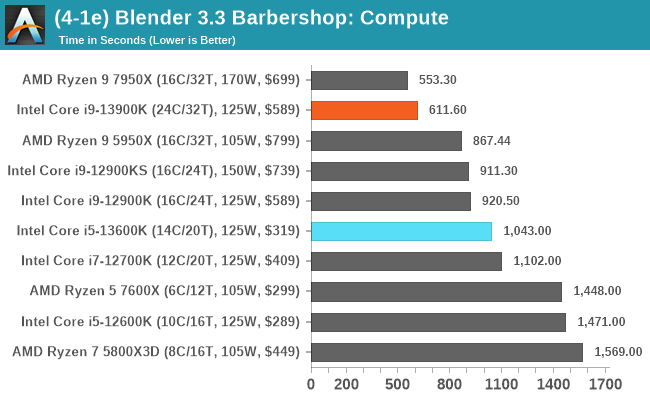
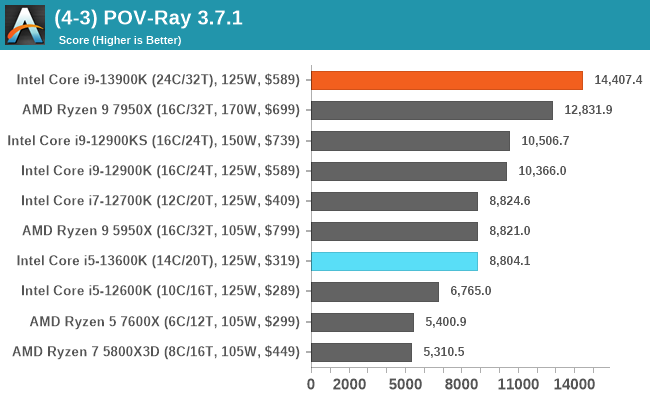
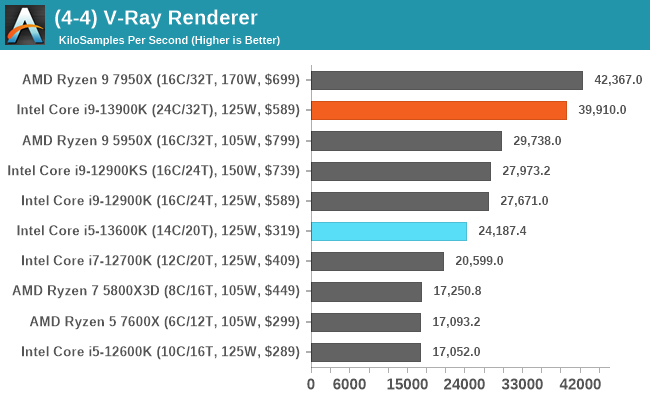
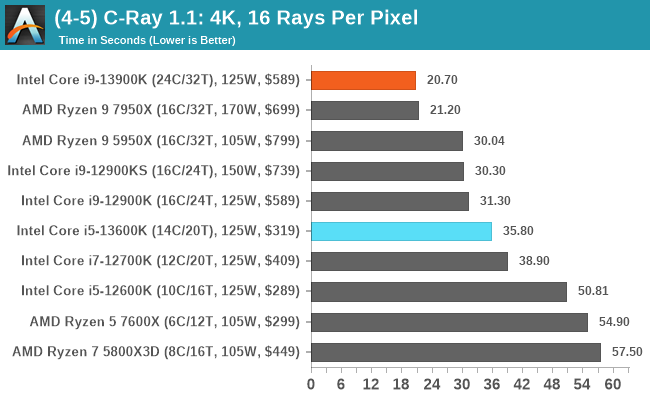
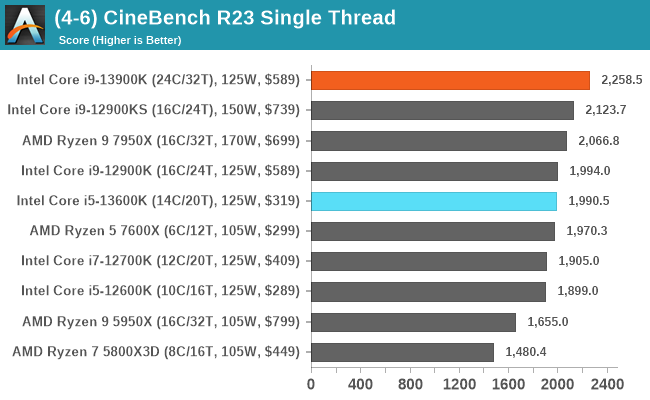
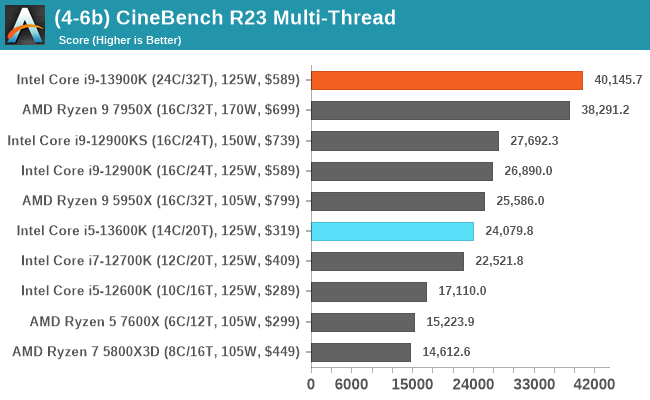
Identifying what core comes where in our rendering tests, both the Core i9-13900K and Ryzen 9 7950X sit comfortably at the top of the tree. Depending on the test, it’s a consistent battle for rendering supremacy. Where things aren’t as close are in our POV-Ray and V-Ray tests, where the Core i9-13900K has a distinct advantage; likely down to having eight more logical cores than the 7950X.
Encoding
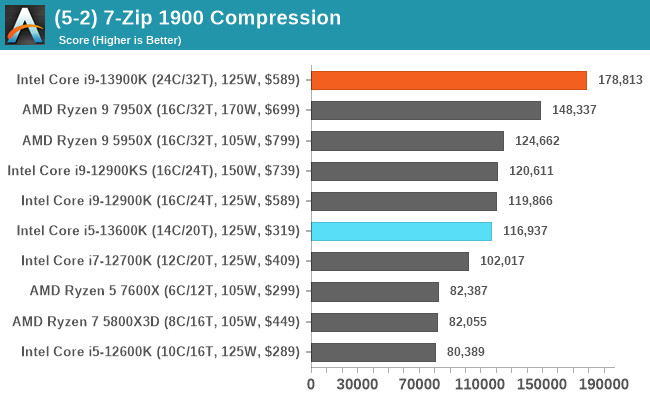
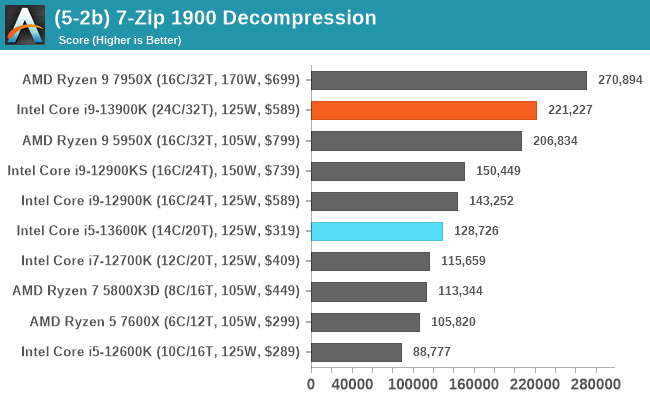
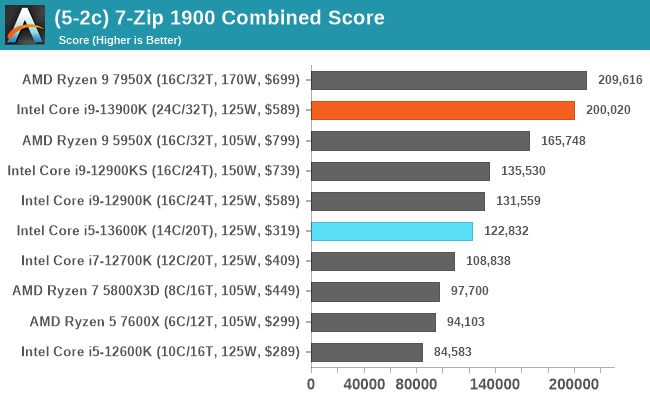
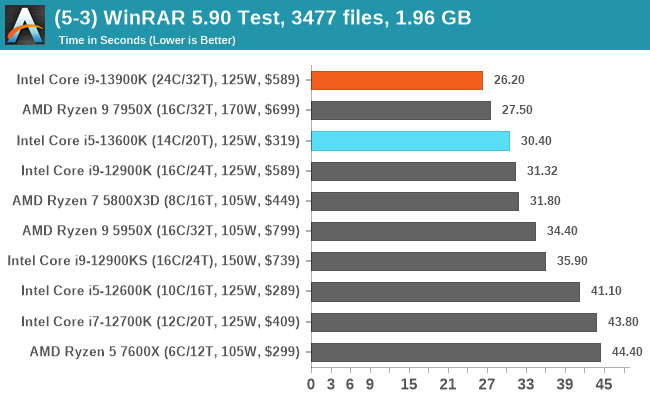
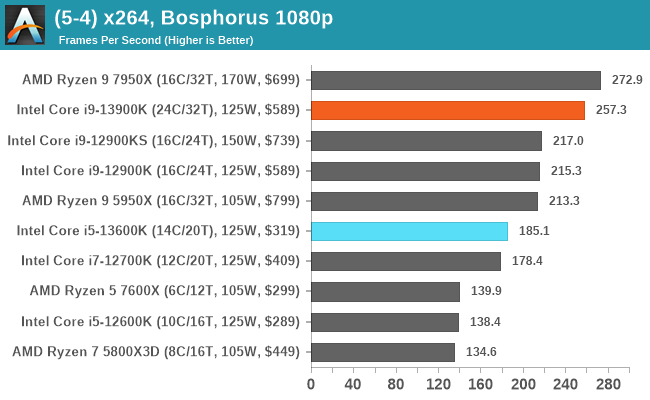
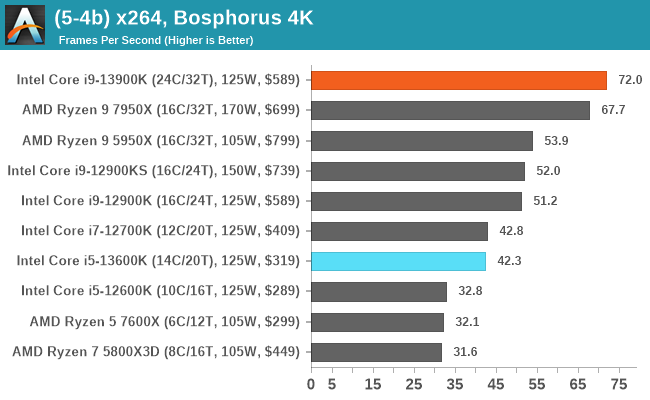
In our encoding tests, interestingly the Core i9-13900K looks to have the advantage in compressing files with 7-Zip. It’s a little different for AMD as the Ryzen 9 7950X decompresses the data better, with the overall combined advantage going to AMD in this particular test. In our updated x264 benchmark, Intel takes the lead in 4K encoding, while AMD has the lead in 1080p encoding; both are equally viable options, however.


169 Comments
View All Comments
Pjotr - Thursday, October 20, 2022 - link
Closing thoughts typos: Ryzen 580X3D and Ryzen 700. ReplyRyan Smith - Thursday, October 20, 2022 - link
Thanks! Replymode_13h - Thursday, October 20, 2022 - link
Thanks for the review!Could you please add the aggregates, in the SPEC 2017 scores? There's usually a summary chart that has an average of the individual benchmarks, and then it often has the equivalent scores from more CPUs/configurations than the individual test graphs contain. For example, see the Alder Lake review:
https://www.anandtech.com/show/17047/the-intel-12t... Reply
Arbie - Thursday, October 20, 2022 - link
TechSpot / Hardware Unboxed show that to complete a Blender job the 13900K takes 50% more total system energy than does the 7950X. Intel completing a Cinebench job takes 70% more energy. Meaning heat in the room. And that's with the Intel chip thermal throttling instantly on even the best cooling.Looking at AT's "Power" charts here, which list the Intel chip as "125W" and AMD as "170W", many readers will get EXACTLY THE OPPOSITE impression.
Sure, you mention the difficulties in comparing TDPs etc, and compare this gen Intel to last gen etc but none of that "un-obscures" the totally erroneous Intel vs AMD picture you've conveyed.
ESPECIALLY when your conclusion says they're "very close in performance" !! BAD JOB, AT. The worst I've seen here in a very long time. Incomprehensibly bad. Reply
gezafisch - Thursday, October 20, 2022 - link
Cope harder - watch Der8auer's video showing that the 13900k can beat any chip at efficiency with the right settings - https://youtu.be/H4Bm0Wr6OEQ ReplyRyan Smith - Thursday, October 20, 2022 - link
We go into the subject of power consumption at multiple points and with multiple graphs, including outlining the 13900K's high peak power consumption in the conclusion.https://images.anandtech.com/graphs/graph17601/130...
Otherwise, the only place you see 125W and 170W are in the specification tables. And those values are the official specifications for those chips. Reply
boeush - Thursday, October 20, 2022 - link
Not true. You have those insanely misleading "TDP" labels on every CPU in the legend of every performance comparison chart. This paints a very misleading picture of "competitive" performance, whereas performance at iso-power (e.g. normalized per watt, based on total system power consumption measured at the outlet) would be much more enlightening. Replyboeush - Thursday, October 20, 2022 - link
*per watt-hour (not per watt)[summed over the duration of the benchmark run] Reply
dgingeri - Thursday, October 20, 2022 - link
Is it just me, or does the L1 cache arrangement seem a bit odd? 48k data and 32k instruction for the P cores and 32k data and 64k instruction on the e-cores. Seems a bit odd to me. ReplyOtritus - Thursday, October 20, 2022 - link
Golden/Raptor Cove has a micro-op cache for instructions. 4096 micro-ops is about equal to 16Kb of instruction cache, which is effectively 48Kb-D + 48Kb-I. I don’t remember whether Gracemont has a micro-op cache. However, it doesn’t have hyperthreading, so maybe it just needs less data cache per core. Reply