ASUS PN50 mini-PC Review: A Zen 2 Business NUC
by Ganesh T S on October 1, 2021 10:00 AM EST- Posted in
- Systems
- AMD
- Asus
- NUC
- UCFF
- Mini-PC
- Zen 2
- Ryzen Embedded
- Renoir
- Ryzen 4000
- Ryzen 7 4800U
Additional Benchmarks: x265, Cinebench, & More
This section looks at some of the other commonly used benchmarks representative of the performance of specific real-world applications.
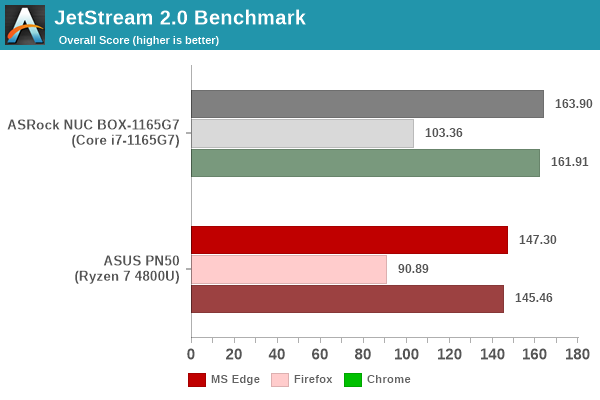
Web Browser Benchmarks - JetStream and Speedometer
Web browser-based workloads have emerged as a major component of the typical home and business PC usage scenarios. Beginning with this review, we are including browser-focused benchmarks from the WebKit developers. Hosted at BrowserBench, JetStream 2.0 benchmarks JavaScript and WebAssembly performance, while Speedometer measures web application responsiveness. We also process MotionMark, but the confidence level of the results vary as much as +/-35%. Hence, we present only the Jetstream 2.0 and Speedometer results for the three top browsers below.
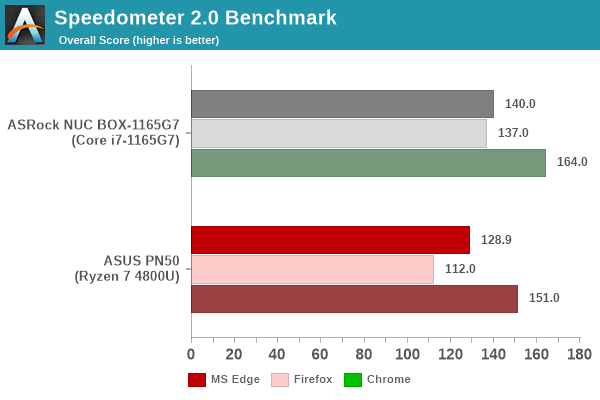
In order to maintain reproducibility, we self-host the BrowserBench benchmarks (git clone of the WebKit repository as on July 1, 2021). The browser versions used for the numbers above are presented in the table included in each system's review. Since this is a new benchmark in the suite, the tables for all systems presented in the graphs above are given below.
| ASUS PN50 Browser Bench | |||
| Speedometer 2.0 | JetStream 2.0 | MotionMark 1.2 | |
| Microsoft Edge (92.0.902.55) |
128.9 ± 0.71 | 147.297 | 606.66 ± 11.24% |
| Google Chrome (92.0.4515.107) |
151 ± 2.0 | 145.461 | 791.74 ± 7.38% |
| Mozilla Firefox (90.0.2.7872) |
112 ± 1.2 | 90.885 | 301.5 ± 31.03% |
BAPCo's SYSmark 25 and UL's PCMark benchmarks both include web browser activities as part of their evaluation scheme. However, the performance for this increasingly important workload tends to get lost in the presentation of a single number. JetStream and Speedometer help us focus on how different PC configurations vary in terms of the user experience with respect to web browsers. Single-threaded performance matters heavily for web browsing, and that is brought out in the higher scores for the NUC BOX-1165G7 compared to the PN50 for both JetStream and Speedometer.
3D Rendering - CINEBENCH R23
We use CINEBENCH R23 for 3D rendering evaluation. R23 provides two benchmark modes - single threaded and multi-threaded. Evaluation of different PC configurations in both supported modes provided us the following results.
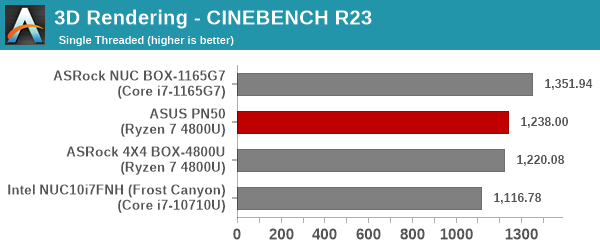
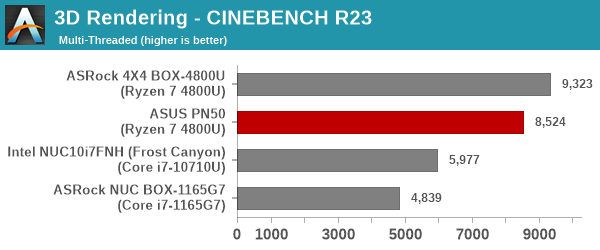
As expected, the multi-threaded case sees the two Renoir mini-PCs handily outwit the 6C/12T Frost Canyon NUC and the 4C/8T Tiger Lake NUC BOX. The Tiger Lake processor has a handy ST performance lead, as expected.
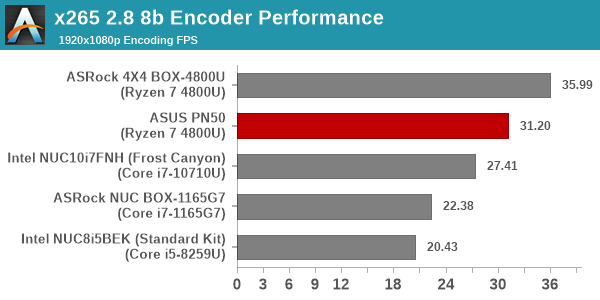
x265 Benchmark
Next up, we have some video encoding benchmarks using x265 v2.8. The appropriate encoder executable is chosen based on the supported CPU features. In the first case, we encode 600 1080p YUV 4:2:0 frames into a 1080p30 HEVC Main-profile compatible video stream at 1 Mbps and record the average number of frames encoded per second.
Our second test case is 1200 4K YUV 4:2:0 frames getting encoded into a 4Kp60 HEVC Main10-profile video stream at 35 Mbps. The encoding FPS is recorded.
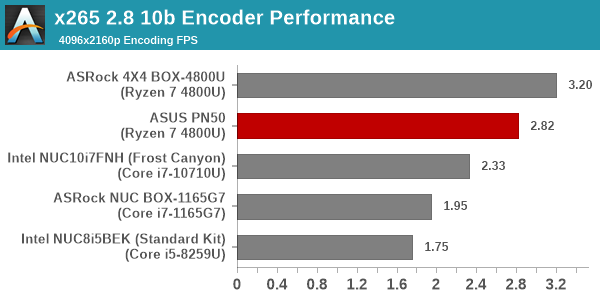
Both workloads reveal performance scaling with number of cores, as even the CML-U-based Frost Canyon NUC outperforms the NUC BOX-1165G7. With a 8C/16T configuration, the ASUS PN50 and the ASRock Industrial 4X4 BOX-4800U have no trouble getting a handsome lead in the performance for these workloads.
7-Zip
7-Zip is a very effective and efficient compression program, often beating out OpenCL accelerated commercial programs in benchmarks even while using just the CPU power. 7-Zip has a benchmarking program that provides tons of details regarding the underlying CPU's efficiency. In this subsection, we are interested in the compression and decompression rates when utilizing all the available threads for the LZMA algorithm.
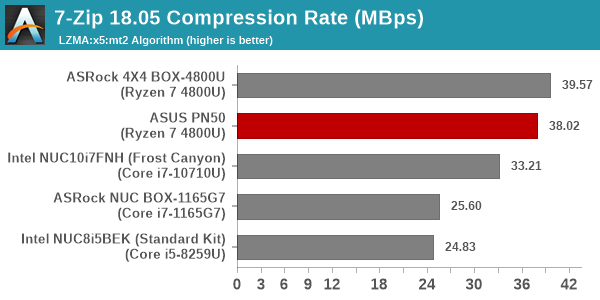
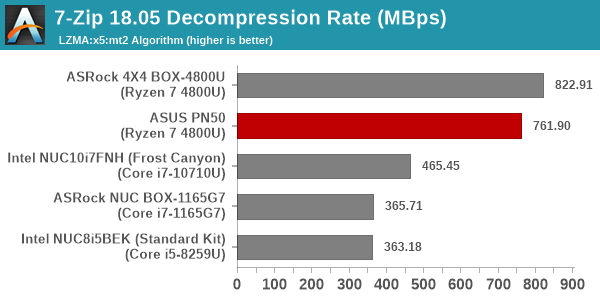
MT performance again plays a major role. With multiple cores available to process the compression / decompression, the rate can scale linearly as long as the memory subsystem is able to keep the cores fed. The extra cores in the Ryzen 7 4800U help the two Renoir systems to beat the Intel-based offerings with a handsome margin.
Cryptography Benchmarks
Cryptography has become an indispensable part of our interaction with computing systems. Almost all modern systems have some sort of hardware-acceleration for making cryptographic operations faster and more power efficient. In this sub-section, we look at two different real-world applications that may make use of this acceleration.
BitLocker is a Windows features that encrypts entire disk volumes. While drives that offer encryption capabilities are dealt with using that feature, most legacy systems and external drives have to use the host system implementation. Windows has no direct benchmark for BitLocker. However, we cooked up a BitLocker operation sequence to determine the adeptness of the system at handling BitLocker operations. We start off with a 2.5GB RAM drive in which a 2GB VHD (virtual hard disk) is created. This VHD is then mounted, and BitLocker is enabled on the volume. Once the BitLocker encryption process gets done, BitLocker is disabled. This triggers a decryption process. The times taken to complete the encryption and decryption are recorded. This process is repeated 25 times, and the average of the last 20 iterations is graphed below.
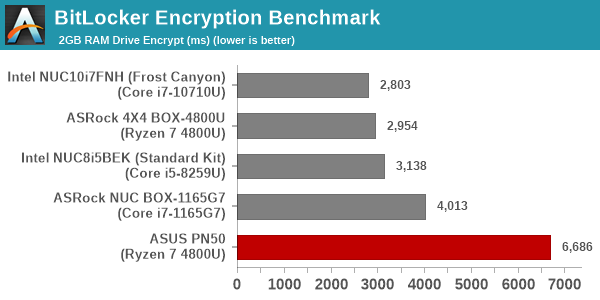
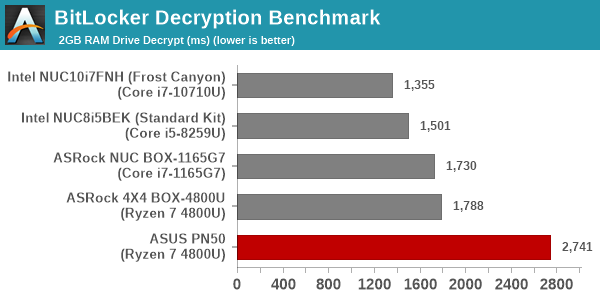
The PN50 is comparatively slower at processing BitLocker volumes in software (the 4X4 BOX-4800U with the same processor doesn't have the issue). It is likely that default BIOS settings are putting the system at a disadvantage.
Creation of secure archives is best done through the use of AES-256 as the encryption method while password protecting ZIP files. We re-use the benchmark mode of 7-Zip to determine the AES256-CBC encryption and decryption rates using pure software as well as AES-NI. Note that the 7-Zip benchmark uses a 48KB buffer for this purpose.
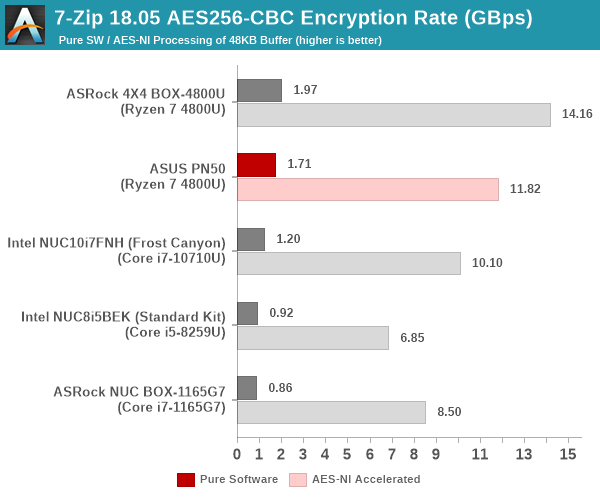
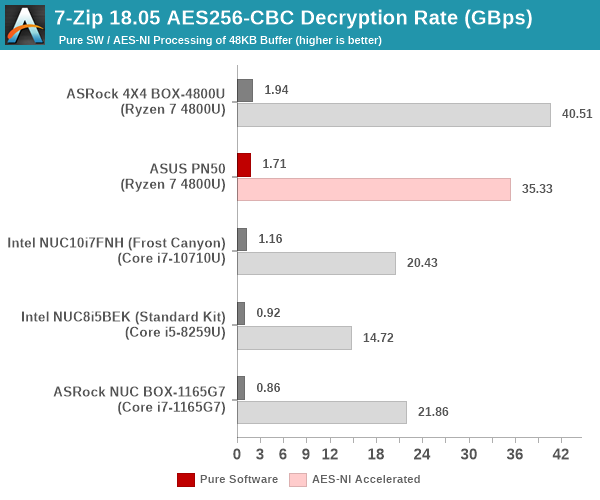
The issues seen in the BitLocker benchmark are not seen here, as we can see 7-Zip cryptographic functions getting accelerated handsomely compared to Intel's offerings. Both AES-NI acceleration and software performance scale with the number of cores.
Yet another cryptography application is secure network communication. OpenSSL can take advantage of the acceleration provided by the host system to make operations faster. It also has a benchmark mode that can use varying buffer sizes. We recorded the processing rate for a 8KB buffer using the hardware-accelerated AES256-CBC-HAC-SHA1 feature.
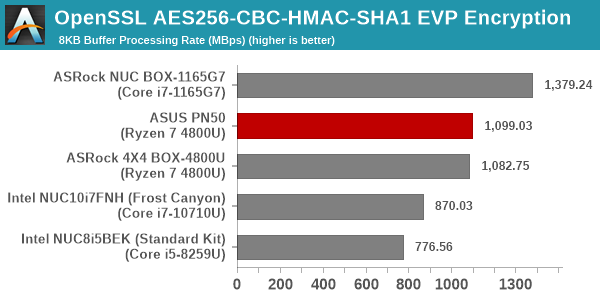
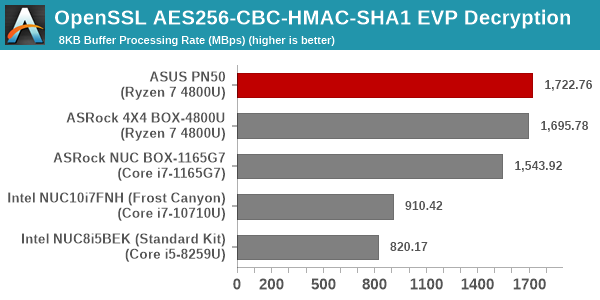
Both Frost Canyon and Bean Canyon had an issue with OpenSSL cryptography performance compared to Renoir APUs. The Tiger Lake improvements now give it a handy lead in the encryption case, and narrows the gap for the decryption case.
Agisoft Photoscan
Agisoft PhotoScan is a commercial program that converts 2D images into 3D point maps, meshes and textures. The program designers sent us a command line version in order to evaluate the efficiency of various systems that go under our review scanner. The command line version has two benchmark modes, one using the CPU and the other using both the CPU and GPU (via OpenCL). We present the results from our evaluation using the CPU mode only. The benchmark (v1.3) takes 84 photographs and does four stages of computation:
- Stage 1: Align Photographs (capable of OpenCL acceleration)
- Stage 2: Build Point Cloud (capable of OpenCL acceleration)
- Stage 3: Build Mesh
- Stage 4: Build Textures
We record the time taken for each stage. Since various elements of the software are single threaded, and others multithreaded, it is interesting to record the effects of CPU generations, speeds, number of cores, and DRAM parameters using this software.
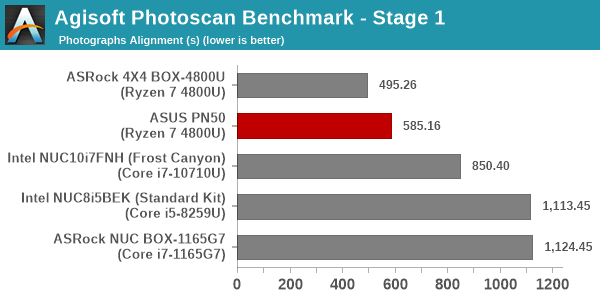
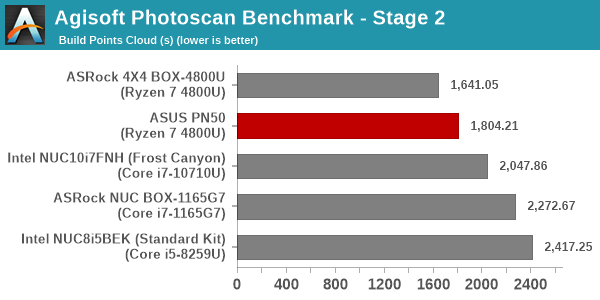
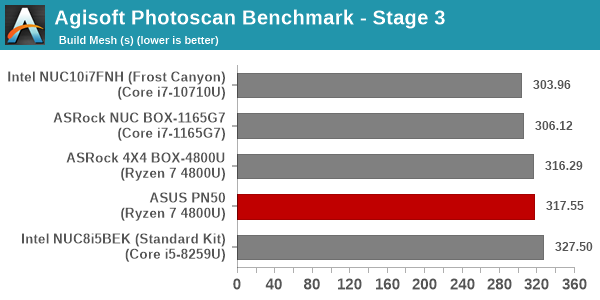
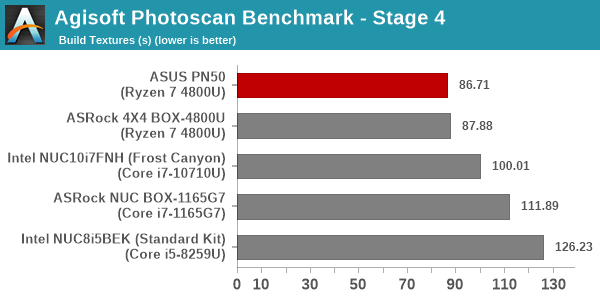
The performance for most of the stages scales well with the number of cores, and hence we see the two Renoir-based mini-PCs appear in the top of the charts.
Dolphin Emulator
Wrapping up our application benchmark numbers is the new Dolphin Emulator (v5) benchmark mode results. This is again a test of the CPU capabilities - more specifically, single-threaded performance.
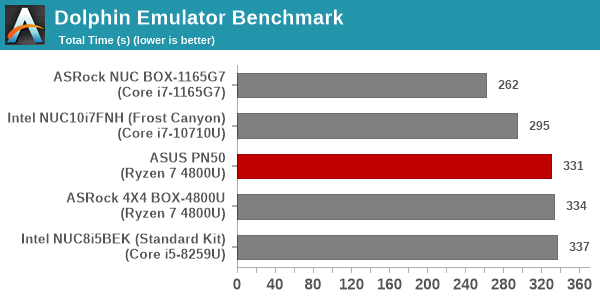
The Tiger Lake-based NUC BOX-1165G7 emerges as the winner by a handsome margin, with the Renoir-based systems relegated to performance similar to that of the Bean Canyon NUC.


32 Comments
View All Comments
Maksdampf - Saturday, October 2, 2021 - link
Beware! There is no such thing as a Ryzen 2 pr Ryzen 3, only Ryzen 2000 and Ryzen 3000, which are 14nm and 12nm Products based in Zen1 Architecture. I think what you mean is Zen3 or in Marketing terms Ryzen 5000 and Zen2 or in marketing terms Ryzen 3000 Desktop and 4000 Notebook series. Don't mix these terms as nobody will be able to understand you!brentpresley - Saturday, October 2, 2021 - link
Why review the PN50, when the PN51 is out with a Ryzen 5700U? I have both, and the PN51 is an incremental but welcome upgrade (2.5Gbs Ethernet, faster GPU, etc.)abufrejoval - Saturday, October 2, 2021 - link
I guess they can only review what they receive as a sample...The upgrade of the PN51 is unfortunately minimal, as it again the lesser Lucienne SoC (Zen 2) 5700U and not the faster Cezanne (Zen 3) 5800U. The biggest advantage seems to be better power management vs. the 4800U.
Also 2.5Gbit seems to be an option not built in by default. On the other hand USB3 2.5 Gbit Adapters are cheap and easy to obtain, just a bit more messy in terms of cabling.
fun_cheung - Friday, October 22, 2021 - link
I'd be interested in seeing some benchmarks on the 5800U as well. PN51 with 2.5GbE is tempting and so is the Gigabyte BRIX 5800U with 2.5GbEkapqa - Saturday, October 2, 2021 - link
Thank you for the interesting review!It seems however, that there is conflicting info on the Miscellaneous I/O Ports Present, it seems on the frontpage in the overview box it is mistakenly labeled as TypeA Usb 3.2 Gen 2, but probably should be USB 3.2 Gen1.
kapqa - Saturday, October 2, 2021 - link
would be nice to have the faster Type A USB 3.2 Gen 2, as also my Asrock A300 sports only Gen1.Oxford Guy - Saturday, October 2, 2021 - link
Did I miss it or was no information presented concerning noise?Decibels-per-watt, noise character, etc.
Oxford Guy - Saturday, October 2, 2021 - link
Extra-small PCs are a dubious proposition unless their small size is critically important.Otherwise performance-per-dollar, speed-per-watt, and noise efficiency are typically all drawbacks that the smaller form factor’s cuteness can’t justify.
nandnandnand - Saturday, October 2, 2021 - link
A well-designed mini PC ought to have low noise. Even if it has a fan, ~20-25 Watts isn't much. The 45W 5900HX and 65W 5700G can be stuffed into mini PCs, and Intel puts discrete GPUs in NUCs.Performance per dollar continues to be bad. Bad vs. a desktop, and I see 5700U laptop deals in the $650-750 range that compare well to either the barebones or configured price.
Oxford Guy - Sunday, October 3, 2021 - link
A larger box makes lower noise easier to achieve at any price point. Vertically-mounted low-RPM 120mm sleeve fans, for instance, are dirt cheap.