Intel Core i7-11700K Review: Blasting Off with Rocket Lake
by Dr. Ian Cutress on March 5, 2021 4:30 PM EST- Posted in
- CPUs
- Intel
- 14nm
- Xe-LP
- Rocket Lake
- Cypress Cove
- i7-11700K
CPU Tests: Simulation
Simulation and Science have a lot of overlap in the benchmarking world, however for this distinction we’re separating into two segments mostly based on the utility of the resulting data. The benchmarks that fall under Science have a distinct use for the data they output – in our Simulation section, these act more like synthetics but at some level are still trying to simulate a given environment.
DigiCortex v1.35: link
DigiCortex is a pet project for the visualization of neuron and synapse activity in the brain. The software comes with a variety of benchmark modes, and we take the small benchmark which runs a 32k neuron/1.8B synapse simulation, similar to a small slug.
The results on the output are given as a fraction of whether the system can simulate in real-time, so anything above a value of one is suitable for real-time work. The benchmark offers a 'no firing synapse' mode, which in essence detects DRAM and bus speed, however we take the firing mode which adds CPU work with every firing.

The software originally shipped with a benchmark that recorded the first few cycles and output a result. So while fast multi-threaded processors this made the benchmark last less than a few seconds, slow dual-core processors could be running for almost an hour. There is also the issue of DigiCortex starting with a base neuron/synapse map in ‘off mode’, giving a high result in the first few cycles as none of the nodes are currently active. We found that the performance settles down into a steady state after a while (when the model is actively in use), so we asked the author to allow for a ‘warm-up’ phase and for the benchmark to be the average over a second sample time.
For our test, we give the benchmark 20000 cycles to warm up and then take the data over the next 10000 cycles seconds for the test – on a modern processor this takes 30 seconds and 150 seconds respectively. This is then repeated a minimum of 10 times, with the first three results rejected. Results are shown as a multiple of real-time calculation.
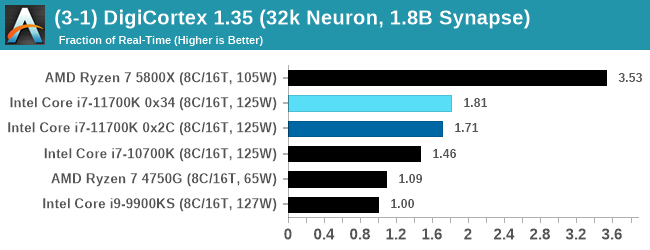
AMD's single chiplet design seems to get a big win here, but DigiCortex can use AVX-512 so the 11700K gets a healthy boost over the previous generation.
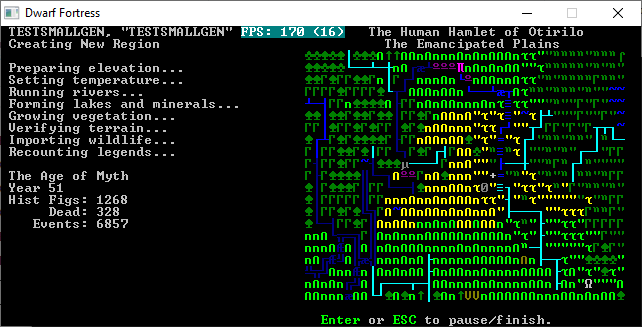
Dwarf Fortress 0.44.12: Link
Another long standing request for our benchmark suite has been Dwarf Fortress, a popular management/roguelike indie video game, first launched in 2006 and still being regularly updated today, aiming for a Steam launch sometime in the future.
Emulating the ASCII interfaces of old, this title is a rather complex beast, which can generate environments subject to millennia of rule, famous faces, peasants, and key historical figures and events. The further you get into the game, depending on the size of the world, the slower it becomes as it has to simulate more famous people, more world events, and the natural way that humanoid creatures take over an environment. Like some kind of virus.
For our test we’re using DFMark. DFMark is a benchmark built by vorsgren on the Bay12Forums that gives two different modes built on DFHack: world generation and embark. These tests can be configured, but range anywhere from 3 minutes to several hours. After analyzing the test, we ended up going for three different world generation sizes:
- Small, a 65x65 world with 250 years, 10 civilizations and 4 megabeasts
- Medium, a 127x127 world with 550 years, 10 civilizations and 4 megabeasts
- Large, a 257x257 world with 550 years, 40 civilizations and 10 megabeasts
DFMark outputs the time to run any given test, so this is what we use for the output. We loop the small test for as many times possible in 10 minutes, the medium test for as many times in 30 minutes, and the large test for as many times in an hour.
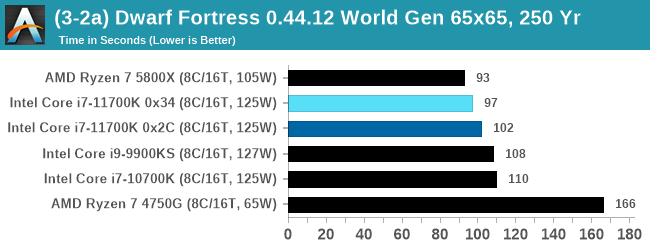
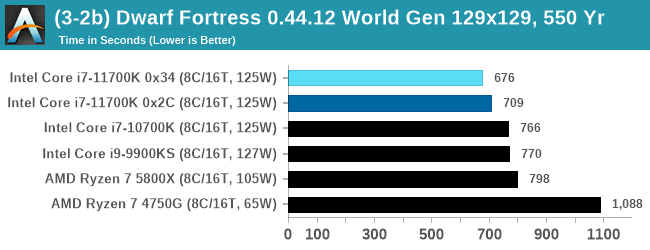
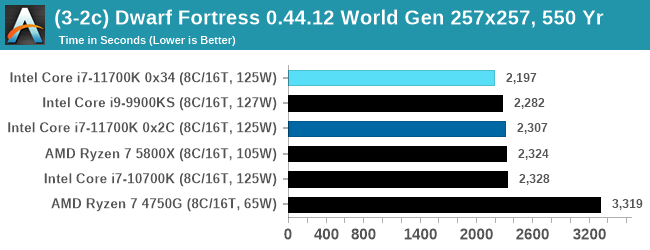
With the small worlds, the 11700K gets a small boost over previous Intel hardware, but this evens out as the worlds get bigger.
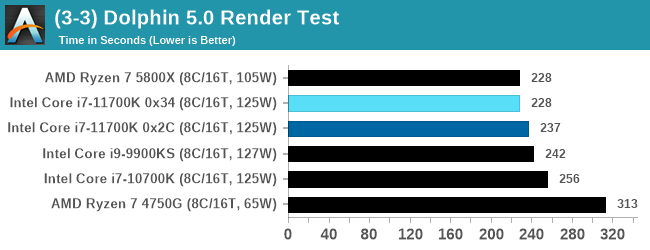
Dolphin v5.0 Emulation: Link
Many emulators are often bound by single thread CPU performance, and general reports tended to suggest that Haswell provided a significant boost to emulator performance. This benchmark runs a Wii program that ray traces a complex 3D scene inside the Dolphin Wii emulator. Performance on this benchmark is a good proxy of the speed of Dolphin CPU emulation, which is an intensive single core task using most aspects of a CPU. Results are given in seconds, where the Wii itself scores 1051 seconds.
CPU Tests: Rendering
Rendering tests, compared to others, are often a little more simple to digest and automate. All the tests put out some sort of score or time, usually in an obtainable way that makes it fairly easy to extract. These tests are some of the most strenuous in our list, due to the highly threaded nature of rendering and ray-tracing, and can draw a lot of power. If a system is not properly configured to deal with the thermal requirements of the processor, the rendering benchmarks is where it would show most easily as the frequency drops over a sustained period of time. Most benchmarks in this case are re-run several times, and the key to this is having an appropriate idle/wait time between benchmarks to allow for temperatures to normalize from the last test.
Blender 2.83 LTS: Link
One of the popular tools for rendering is Blender, with it being a public open source project that anyone in the animation industry can get involved in. This extends to conferences, use in films and VR, with a dedicated Blender Institute, and everything you might expect from a professional software package (except perhaps a professional grade support package). With it being open-source, studios can customize it in as many ways as they need to get the results they require. It ends up being a big optimization target for both Intel and AMD in this regard.
For benchmarking purposes, we fell back to one rendering a frame from a detailed project. Most reviews, as we have done in the past, focus on one of the classic Blender renders, known as BMW_27. It can take anywhere from a few minutes to almost an hour on a regular system. However now that Blender has moved onto a Long Term Support model (LTS) with the latest 2.83 release, we decided to go for something different.

We use this scene, called PartyTug at 6AM by Ian Hubert, which is the official image of Blender 2.83. It is 44.3 MB in size, and uses some of the more modern compute properties of Blender. As it is more complex than the BMW scene, but uses different aspects of the compute model, time to process is roughly similar to before. We loop the scene for at least 10 minutes, taking the average time of the completions taken. Blender offers a command-line tool for batch commands, and we redirect the output into a text file.
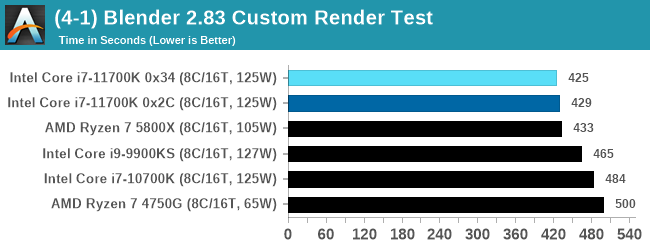
A marginal win for Intel in Blender is a good result, as well as a few % points over the 5.0 GHz 9900KS.
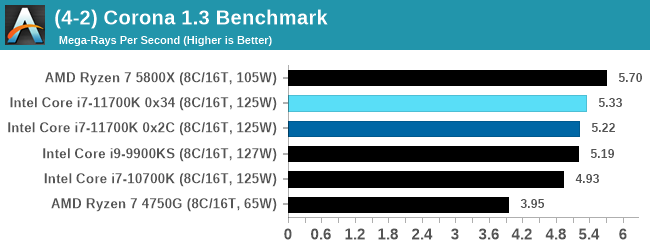
Corona 1.3: Link
Corona is billed as a popular high-performance photorealistic rendering engine for 3ds Max, with development for Cinema 4D support as well. In order to promote the software, the developers produced a downloadable benchmark on the 1.3 version of the software, with a ray-traced scene involving a military vehicle and a lot of foliage. The software does multiple passes, calculating the scene, geometry, preconditioning and rendering, with performance measured in the time to finish the benchmark (the official metric used on their website) or in rays per second (the metric we use to offer a more linear scale).
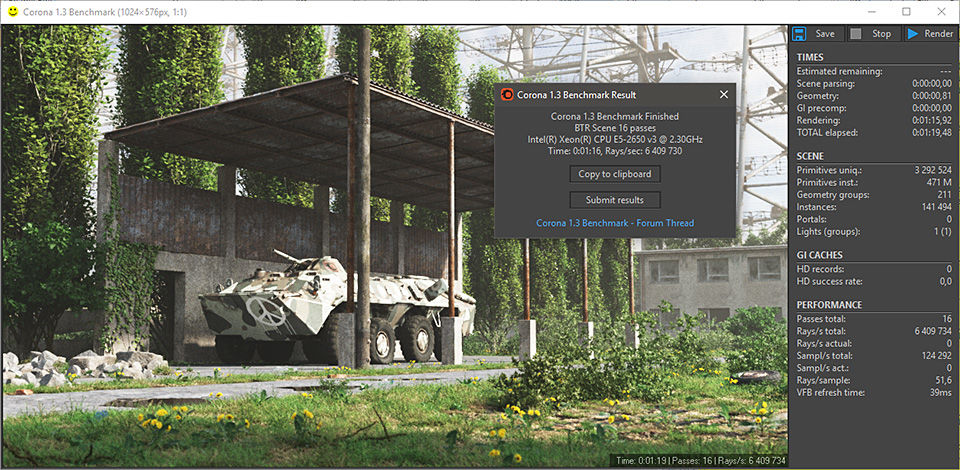
The standard benchmark provided by Corona is interface driven: the scene is calculated and displayed in front of the user, with the ability to upload the result to their online database. We got in contact with the developers, who provided us with a non-interface version that allowed for command-line entry and retrieval of the results very easily. We loop around the benchmark five times, waiting 60 seconds between each, and taking an overall average. The time to run this benchmark can be around 10 minutes on a Core i9, up to over an hour on a quad-core 2014 AMD processor or dual-core Pentium.
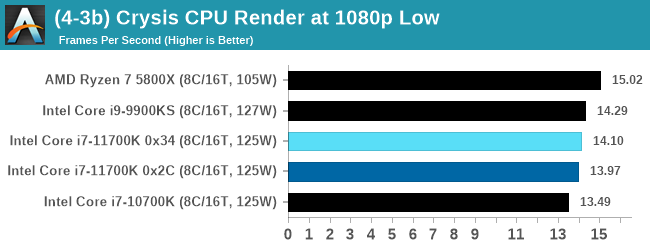
Crysis CPU-Only Gameplay
One of the most oft used memes in computer gaming is ‘Can It Run Crysis?’. The original 2007 game, built in the Crytek engine by Crytek, was heralded as a computationally complex title for the hardware at the time and several years after, suggesting that a user needed graphics hardware from the future in order to run it. Fast forward over a decade, and the game runs fairly easily on modern GPUs.
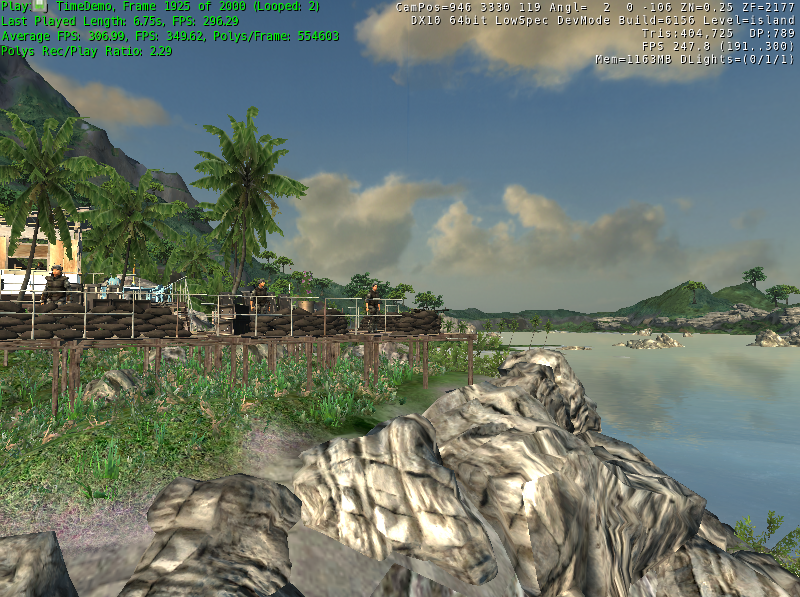
But can we also apply the same concept to pure CPU rendering? Can a CPU, on its own, render Crysis? Since 64 core processors entered the market, one can dream. So we built a benchmark to see whether the hardware can.
For this test, we’re running Crysis’ own GPU benchmark, but in CPU render mode. This is a 2000 frame test, with medium and low settings.
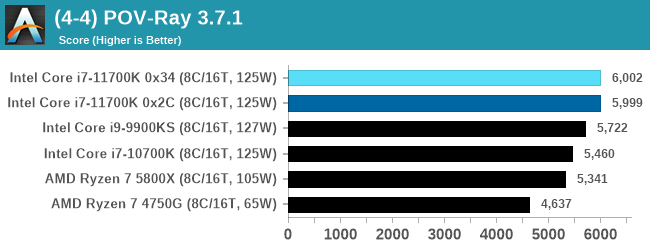
POV-Ray 3.7.1: Link
A long time benchmark staple, POV-Ray is another rendering program that is well known to load up every single thread in a system, regardless of cache and memory levels. After a long period of POV-Ray 3.7 being the latest official release, when AMD launched Ryzen the POV-Ray codebase suddenly saw a range of activity from both AMD and Intel, knowing that the software (with the built-in benchmark) would be an optimization tool for the hardware.
We had to stick a flag in the sand when it came to selecting the version that was fair to both AMD and Intel, and still relevant to end-users. Version 3.7.1 fixes a significant bug in the early 2017 code that was advised against in both Intel and AMD manuals regarding to write-after-read, leading to a nice performance boost.

The benchmark can take over 20 minutes on a slow system with few cores, or around a minute or two on a fast system, or seconds with a dual high-core count EPYC. Because POV-Ray draws a large amount of power and current, it is important to make sure the cooling is sufficient here and the system stays in its high-power state. Using a motherboard with a poor power-delivery and low airflow could create an issue that won’t be obvious in some CPU positioning if the power limit only causes a 100 MHz drop as it changes P-states.
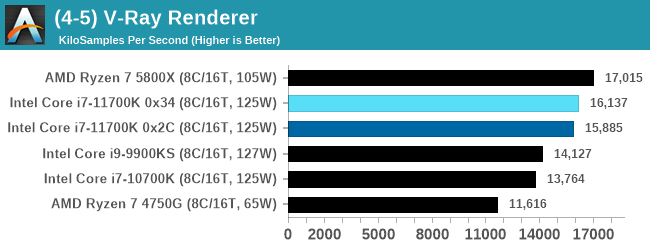
V-Ray: Link
We have a couple of renderers and ray tracers in our suite already, however V-Ray’s benchmark came through for a requested benchmark enough for us to roll it into our suite. Built by ChaosGroup, V-Ray is a 3D rendering package compatible with a number of popular commercial imaging applications, such as 3ds Max, Maya, Undreal, Cinema 4D, and Blender.

We run the standard standalone benchmark application, but in an automated fashion to pull out the result in the form of kilosamples/second. We run the test six times and take an average of the valid results.
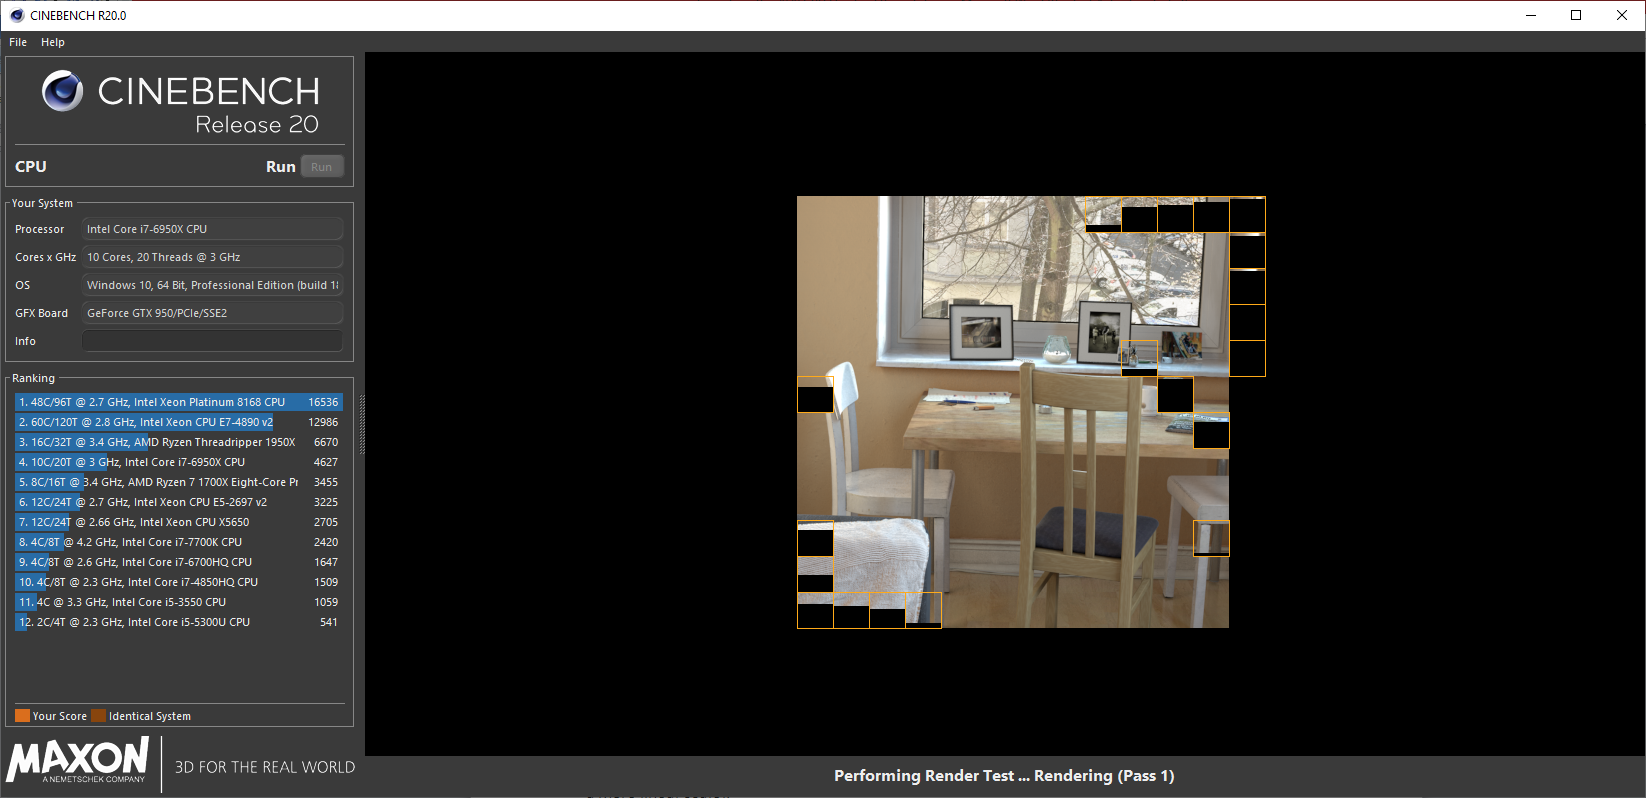
Cinebench R20: Link
Another common stable of a benchmark suite is Cinebench. Based on Cinema4D, Cinebench is a purpose built benchmark machine that renders a scene with both single and multi-threaded options. The scene is identical in both cases. The R20 version means that it targets Cinema 4D R20, a slightly older version of the software which is currently on version R21. Cinebench R20 was launched given that the R15 version had been out a long time, and despite the difference between the benchmark and the latest version of the software on which it is based, Cinebench results are often quoted a lot in marketing materials.
Results for Cinebench R20 are not comparable to R15 or older, because both the scene being used is different, but also the updates in the code bath. The results are output as a score from the software, which is directly proportional to the time taken. Using the benchmark flags for single CPU and multi-CPU workloads, we run the software from the command line which opens the test, runs it, and dumps the result into the console which is redirected to a text file. The test is repeated for a minimum of 10 minutes for both ST and MT, and then the runs averaged.
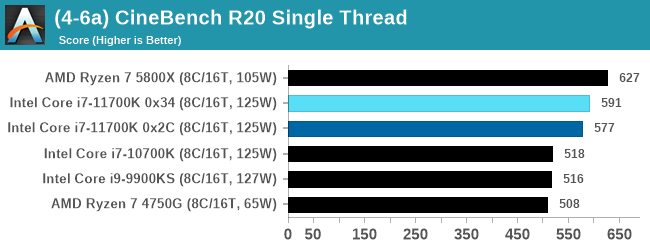
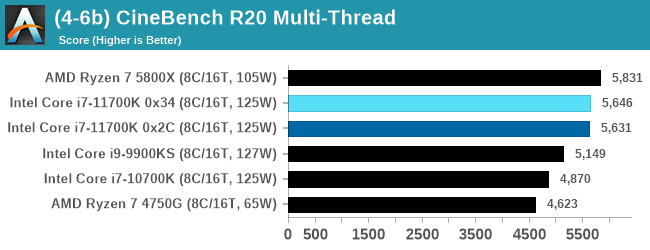
The improvement in Cinebench R20 is a good measure over previous generations of Intel. However mobile Tiger Lake scores 593 at 28 W, still ahead of the 11700K, and they are all behind AMD.


541 Comments
View All Comments
Shorty_ - Monday, March 8, 2021 - link
I'm not sure if you're being wilfully obtuse or ignorant.. the only reason Skylake is even remotely in the game is that intel's 14nm is refined enough to allow them to push raw clock speeds to the moon. Do you not recall how awful Ice Lake was because it couldn't clock? TGL is starting to clock a bit better but it's still pretty damn close. This is on 10nm "superfin" which is ~= TSMC N7(P).So Intel don't have some magic engineering pixie dust that would propel them beyond AMD if they were on the same node.
Thesubtlesnake - Saturday, March 6, 2021 - link
Intel already have process equivalent to 7nm – 10nm SF. And they already designed a new architecture on it: Tiger Lake. And Zen 3 is perfectly competitive with Tiger Lake.Teckk - Friday, March 5, 2021 - link
Ultimately the latest desktop processors from Intel doesn’t perform well against AMD that’s what it is.They chose to release it on 14 nm as their 10nm was still work in progress. The numbers have meaning and not your conjecture about Intel using TSMC advanced node- it’ll be compared whenever that happens, with numbers.
Cooe - Saturday, March 6, 2021 - link
*Zen 3hfm - Saturday, March 6, 2021 - link
But we have to live in reality that they don't even have 10nm ready for desktop. Fantasies about creating an alternate reality where their core architecture exists on a smaller node for desktop are just that, fantasies. The reality is AMD clearly has the far better product right now aside from niche edge cases.I still agree with the conclusion though that given current circumstances, get what you can get if you need to upgrade or build new. But the reality there seems like the 5800X is available at MSRP in-stock at multiple storefronts.
blppt - Friday, March 5, 2021 - link
A chip that is just released, the best Intel currently has to offer for the mainstream consumer, can't match a chip that has been out for months. While using more power.Thats not a good look for Intel. I hope the 11900K (or whatever they're going to call it) at least matches the 5900X in games.
This is the first time in a long time, with generations of chips current, that I cannot think of a single reason to recommend Intel's latest and greatest over AMD.
terroradagio - Friday, March 5, 2021 - link
The 11900k has always been what should be compared to the 5900x anyway. Not the i7-11700k.blppt - Saturday, March 6, 2021 - link
The point being, the 11700k doesn't even catch the 5800X, which has been out for a few months already. Given that this was supposed to be Intel's "response to Zen 3", its pretty disappointing.Fulljack - Saturday, March 6, 2021 - link
the only thing that could save Rocket Lake-S are availability and price. otherwise just get Ryzen 5000 processors.SaturnusDK - Saturday, March 6, 2021 - link
Availability of Ryzen 5000 except 59xx parts is already a non-issue. You can get 5600X with a few days delay at worst, and 5800X is in abundant stock pretty much everywhere.The key is price, especially the platform price because Intel MBs are generally more expensive. On top of that you absolutely need a larger cooler, and most likely also need a beefier PSU for the Intel CPUs, so the CPU price for the intel parts have to be substantially lower than a performance equivalent AMD part to be competitive. And given the history of intel that seems very unlikely to happen.