The Corsair MP400 1TB QLC NVMe SSD: A Quick Review
by Billy Tallis on December 11, 2020 2:00 PM ESTMixed IO Performance
Our tests of mixed read/write IO vary the workload from pure reads to pure writes at 10% increments. Each mix is tested for up to 1 minute or 32GB of data transferred. The mixed random IO test uses a queue depth of 4 while the mixed sequential IO test uses a queue depth of 1. The tests are confined to a 64GB span of the drive, and the drive is given up to one minute of idle time in between each mix tested.
 |
|||||||||
| Mixed Random IO | Mixed Sequential IO | ||||||||
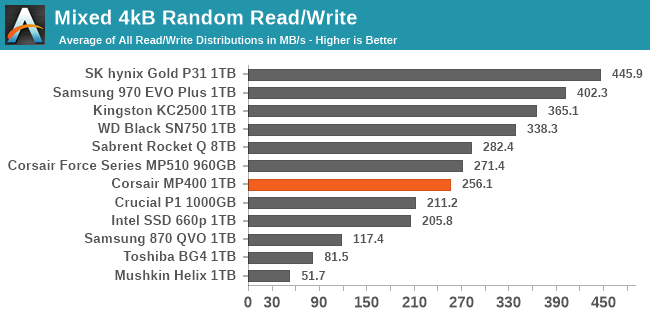
The QLC NVMe drives like the Corsair MP400 have a clear advantage over the DRAMless TLC drives for mixed read/write workloads. This is particularly pronounced for the mixed random IO test, where the DRAMless TLC drives are even slower than the QLC SATA drive. On the mixed sequential IO test, those DRAMless TLC drives can compete with some of the slower QLC NVMe drives, but the 8-channel Phison E12 controller used in the Corsair MP400 and Sabrent Rocket Q helps them stay ahead as the faster budget NVMe strategy.
 |
|||||||||
| Mixed Random IO | Mixed Sequential IO | ||||||||
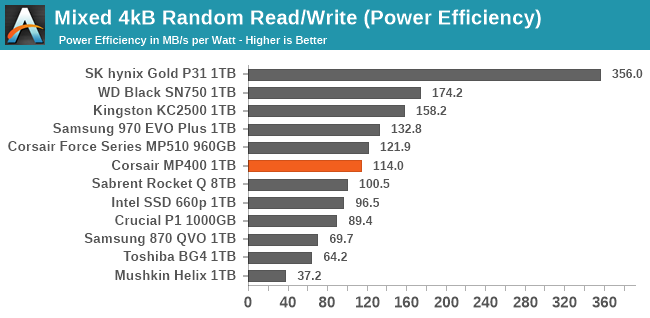
The budget NVMe drives all have worse power efficiency during the mixed IO tests than any of the high-end options, but the Corsair MP400 has some of the best efficiency scores within the budget NVMe segment. The 8TB Sabrent Rocket Q trails behind the 1TB MP400 because of the extra power draw of so many NAND dies.
 |
|||||||||
| Mixed Random IO | |||||||||
| Mixed Sequential IO | |||||||||
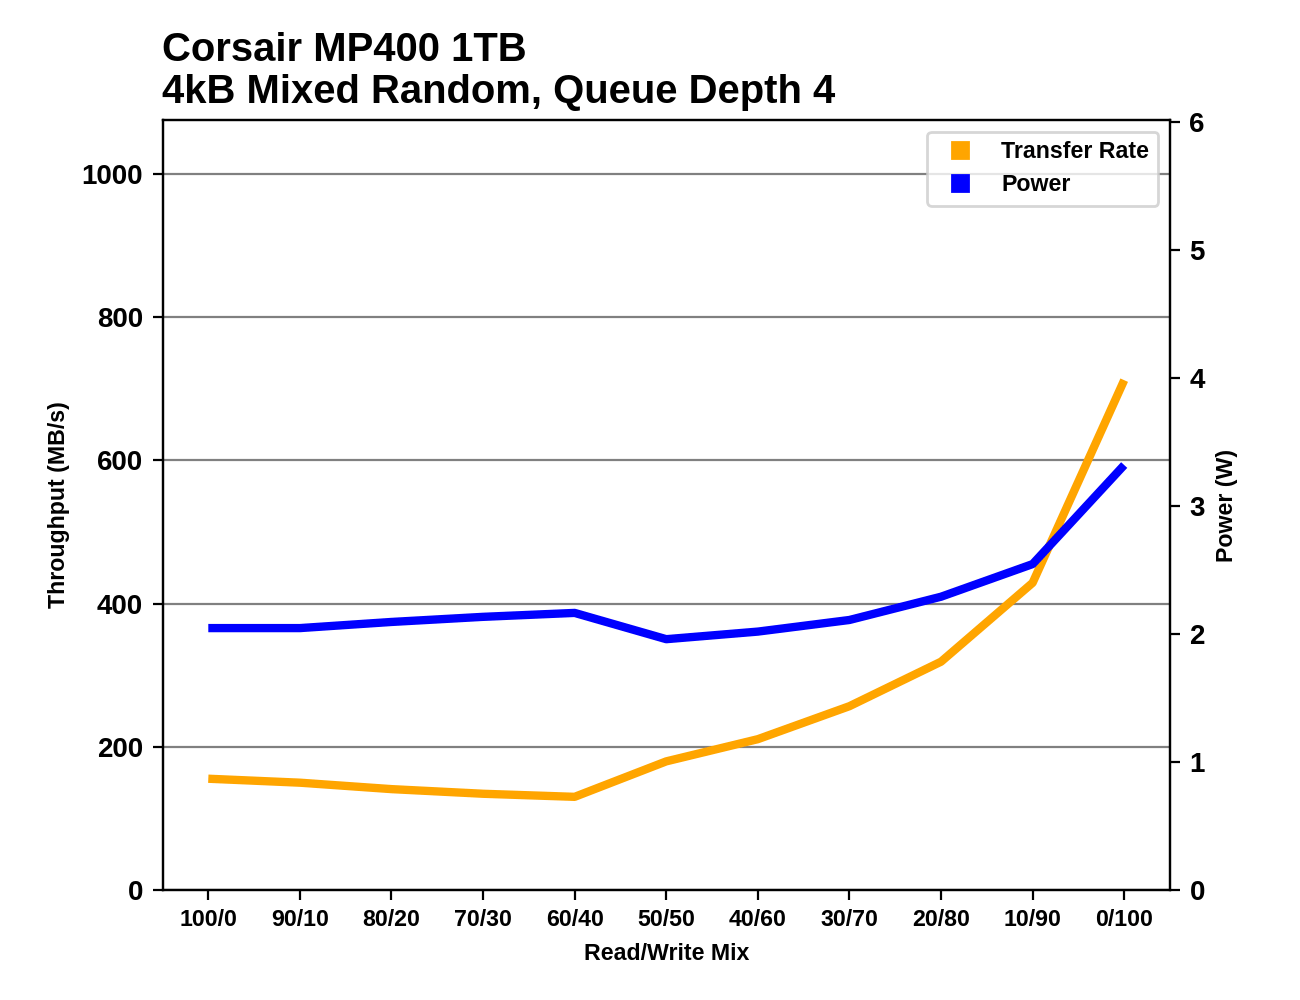
The Corsair MP400's performance curves through the mixed random and sequential IO tests generally resemble what we saw for the Sabrent Rocket Q. On the mixed sequential IO test, the 8TB Rocket Q generally maintained a clear performance lead over the 1TB MP400 (at the cost of much higher power draw), but their performance scaling across the random IO test is very similar. The overall shape of the performance curves for these QLC drives has a lot more in common with mainstream TLC drives than it does with the entry-level DRAMless TLC drives; the QLC drives are slower than mainstream TLC drives, but not as obviously limited as the DRAMless drives.
Idle Power Measurement
SATA SSDs are tested with SATA link power management disabled to measure their active idle power draw, and with it enabled for the deeper idle power consumption score and the idle wake-up latency test. Our testbed, like any ordinary desktop system, cannot trigger the deepest DevSleep idle state.
Idle power management for NVMe SSDs is far more complicated than for SATA SSDs. NVMe SSDs can support several different idle power states, and through the Autonomous Power State Transition (APST) feature the operating system can set a drive's policy for when to drop down to a lower power state. There is typically a tradeoff in that lower-power states take longer to enter and wake up from, so the choice about what power states to use may differ for desktop and notebooks, and depending on which NVMe driver is in use. Additionally, there are multiple degrees of PCIe link power savings possible through Active State Power Management (APSM).
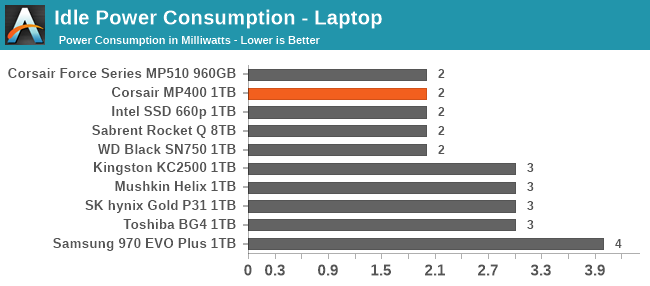
We report three idle power measurements. Active idle is representative of a typical desktop, where none of the advanced PCIe link or NVMe power saving features are enabled and the drive is immediately ready to process new commands. Our Desktop Idle number represents what can usually be expected from a desktop system that is configured to enable SATA link power management, PCIe ASPM and NVMe APST, but where the lowest PCIe L1.2 link power states are not available. The Laptop Idle number represents the maximum power savings possible with all the NVMe and PCIe power management features in use—usually the default for a battery-powered system but rarely achievable on a desktop even after changing BIOS and OS settings. Since we don't have a way to enable SATA DevSleep on any of our testbeds, SATA drives are omitted from the Laptop Idle charts.
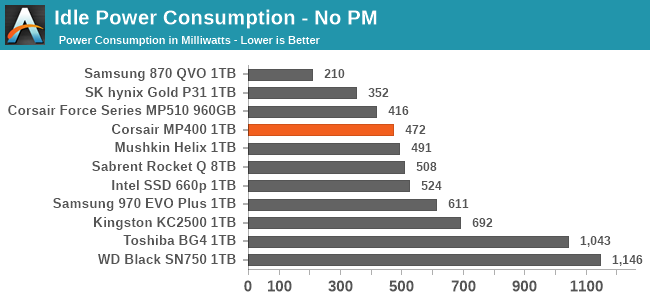
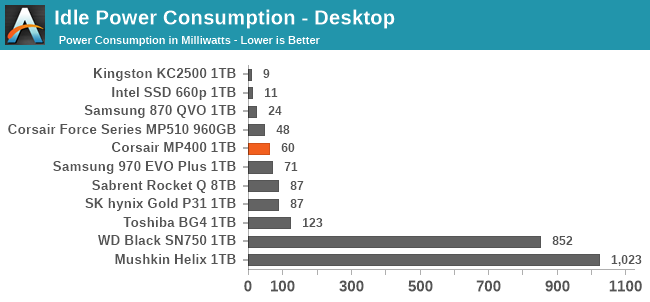
The Corsair MP400 identifies itself as having the same idle power management capabilities as the Sabrent Rocket Q, and significantly lower maximum power draw in its active power states than the very pessimistic figures our 8TB Rocket Q sample provides to the OS.
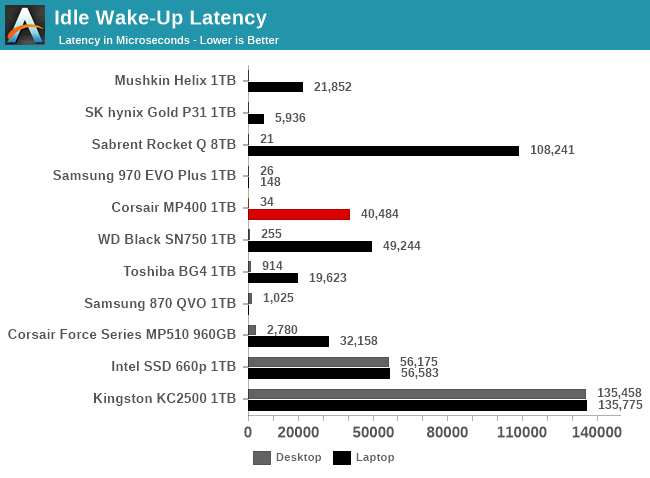
The active and desktop idle power values we measured for the MP400 are a bit lower than for the Rocket Q 8TB, which is to be expected given the lower part count on the 1TB MP400. Waking up from the intermediate desktop idle state is extremely quick, but waking from the deepest sleep state is just a bit on the slow side.


75 Comments
View All Comments
GeoffreyA - Tuesday, December 15, 2020 - link
My mistake! Made a blunder here. LBAs written (241) are the host/OS writes. Well, I can't seem to find SMART value 249 (NAND writes). Cunning work by Samsung, not exposing that value.Is where "Wear Leveling Count" the one to use with the P/E cycles? Mine is at 5. Calculating 5 / 2,000 (for TLC, roughly) doesn't seem to yield a sensible value, against the drive's TBW and the OS writes. I'm stumped.
GeoffreyA - Tuesday, December 15, 2020 - link
Another AT article helped here. Seems to be that 1 P/E cycle equals the capacity of the drive in NAND writes, roughly; and the raw Wear Levelling Count equates to used P/E cycles.Roughly: Raw WLC x drive capacity == NAND writes
For me, I get: 5 x 500 == 2,500 GB
I'm scratching my head though because that yields a write amplification that seems erroneously small, only 1.09x (2,500 nand / 2,300 host).
https://www.anandtech.com/show/8239/update-on-sams...
MDD1963 - Sunday, December 13, 2020 - link
'only 200 TBW'...based on my 10 TB per year as a 4 hours per day 'ordinary desktop user/surfer', the drive would be ending it's life in writes at merely 20 years for me... Best to shop elsewhere! :)nucc1 - Wednesday, December 16, 2020 - link
I just looked at the SMART data for my solid state devices, and I'm averaging 0.03 TB per day. over 660 (total power on) days on my oldest SSD. According to Aida64, the drive still has about 95% remaining lifetime. It's a Samsung Sata 850 EVO 500GB.I like to think I'm not an average user, because this machine is running boinc always, and I use these SSDs for running virtual machines whose lifetime is typically less than 90 days each and, I'm also hosting a media server on this machine for in-home streaming.
I used to worry about longevity too, thinking myself to be a heavy user, but the numbers have not borne this suspicion out.
My current OS boot drive, with bitlocker ON is a sabrent 1TB nvme device, currently averaging 0.022 TB written per day over it's 160 day lifetime, and 99% lifetime remaining. If endurance is the only thing that kills these drives, I have many years of worry-free operation left in all these budget, consumer drives packed into my system.
shabby - Friday, December 11, 2020 - link
Go home corsair, you're drunk...You guys should stop accepting these overpriced qlc junk drives for review.
boozed - Friday, December 11, 2020 - link
Why, so we'll never know how they perform?shabby - Friday, December 11, 2020 - link
We don't need to know how they perform, just their price, we know they all perform like shit.Maverick009 - Friday, December 11, 2020 - link
Not exactly true. QLC drives are still a step up from mechanical drives in certain case scenarios, and depending on the pairing of the controller, can even come close or on par with some of their counterparts.Rather have choice with competition rather then your narrow sight of vision as not every drive is built the same.
Gigaplex - Wednesday, December 16, 2020 - link
And then when a QLC drive comes out that's actually good, we'd never know...kpb321 - Friday, December 11, 2020 - link
Price is always where the QLC drives have failed for me. As the article notes it is usually pretty easy to find an 8 channel with dram drive for minimal price premium over one of the QLC drives. Not to mention the other low cost variants with 4 channels and/or dramless that are almost always available at similar price points and while they might have some compromises also compared the better drives they are usually smaller compromises and easier to accept. I just don't see the QLC drive providing the value if there are TLC alternatives available.