The Corsair MP400 1TB QLC NVMe SSD: A Quick Review
by Billy Tallis on December 11, 2020 2:00 PM ESTBurst IO Performance
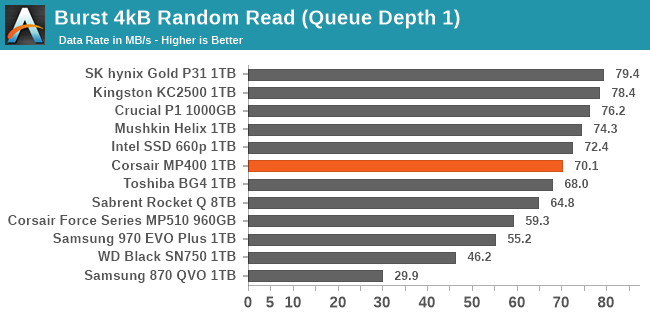
Our burst IO tests run at a queue depth of one and the amount of data transferred is limited to ensure that SLC write buffers don't fill up and controllers don't overheat. In between each burst there's enough idle time to keep the drive averaging a 20% duty cycle, allowing for some buffered writes and deferred garbage collection to be completed. The random read and write tests use 4kB operations and the sequential tests use 128kB operations. All the burst tests are confined to a 16GB portion of the drive, so DRAMless SSDs are not disadvantaged as much as they are for larger tests.
 |
|||||||||
| Random Read | Random Write | ||||||||
| Sequential Read | Sequential Write | ||||||||
The aggressive SLC caching strategy used by the Corsair MP400 and most other QLC NVMe SSDs allows them to provide best-case random IO performance that is competitive with many high-end PCIe 3.0 drives. However, despite the 8-channel controller, the burst sequential IO performance of the Corsiar MP400 is still fairly low by NVMe standards. The Sabrent Rocket Q 8TB's results indicate that at least some of the higher-capacity MP400 models should also be able to provide better burst sequential write speeds by virtue of having larger and faster SLC caches.
Sustained IO Performance
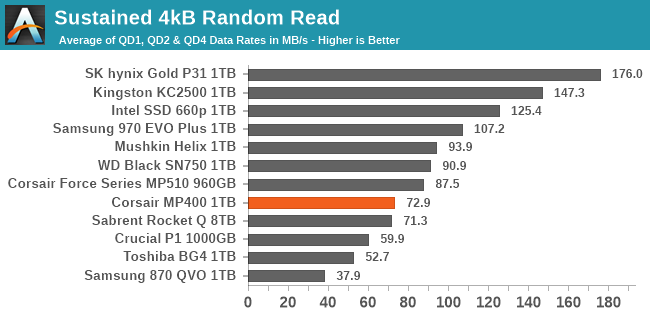
Our sustained IO tests measure performance on queue depths up to 32, but the scores reported here are only the averages for the low queue depths (1,2,4) that are most representative of real-world consumer workloads. Each queue depth is tested for up to one minute or 32GB, and the tests are confined to a 64GB span of the drive.
 |
|||||||||
| Random Read | Random Write | ||||||||
| Sequential Read | Sequential Write | ||||||||
On the longer synthetic IO tests, the Corsair MP400's best results are for random writes, where its SLC cache is sufficient to keep it competitive against high-end PCIe 3 drives. The sequential write and random read performance scores are both constrained to the entry-level NVMe performance ranges, but are competitive for that market segment. The sequential read performance is relatively poor even for entry-level NVMe drives, though still significantly better than Samsung's QLC SATA alternative.
 |
|||||||||
| Random Read | Random Write | ||||||||
| Sequential Read | Sequential Write | ||||||||
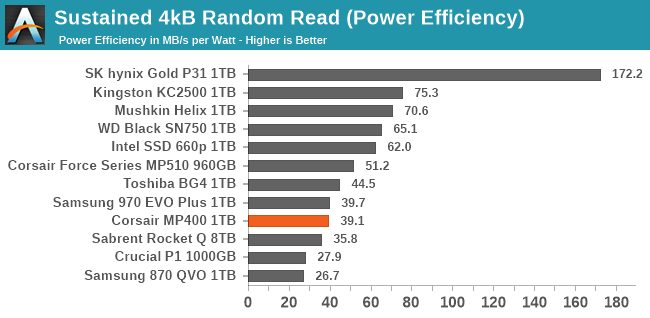
With QLC NAND and an aging 8-channel controller, it's no surprise that the Corsair MP400's power efficiency scores are generally unimpressive, especially compared to what the 4-channel NVMe drives score when they are performing well. However, the only particularly poor efficiency score from the MP400 is for the sequential read test that it did not perform well on.
 |
|||||||||
| Random Read | Random Write | ||||||||
| Sequential Read | Sequential Write | ||||||||
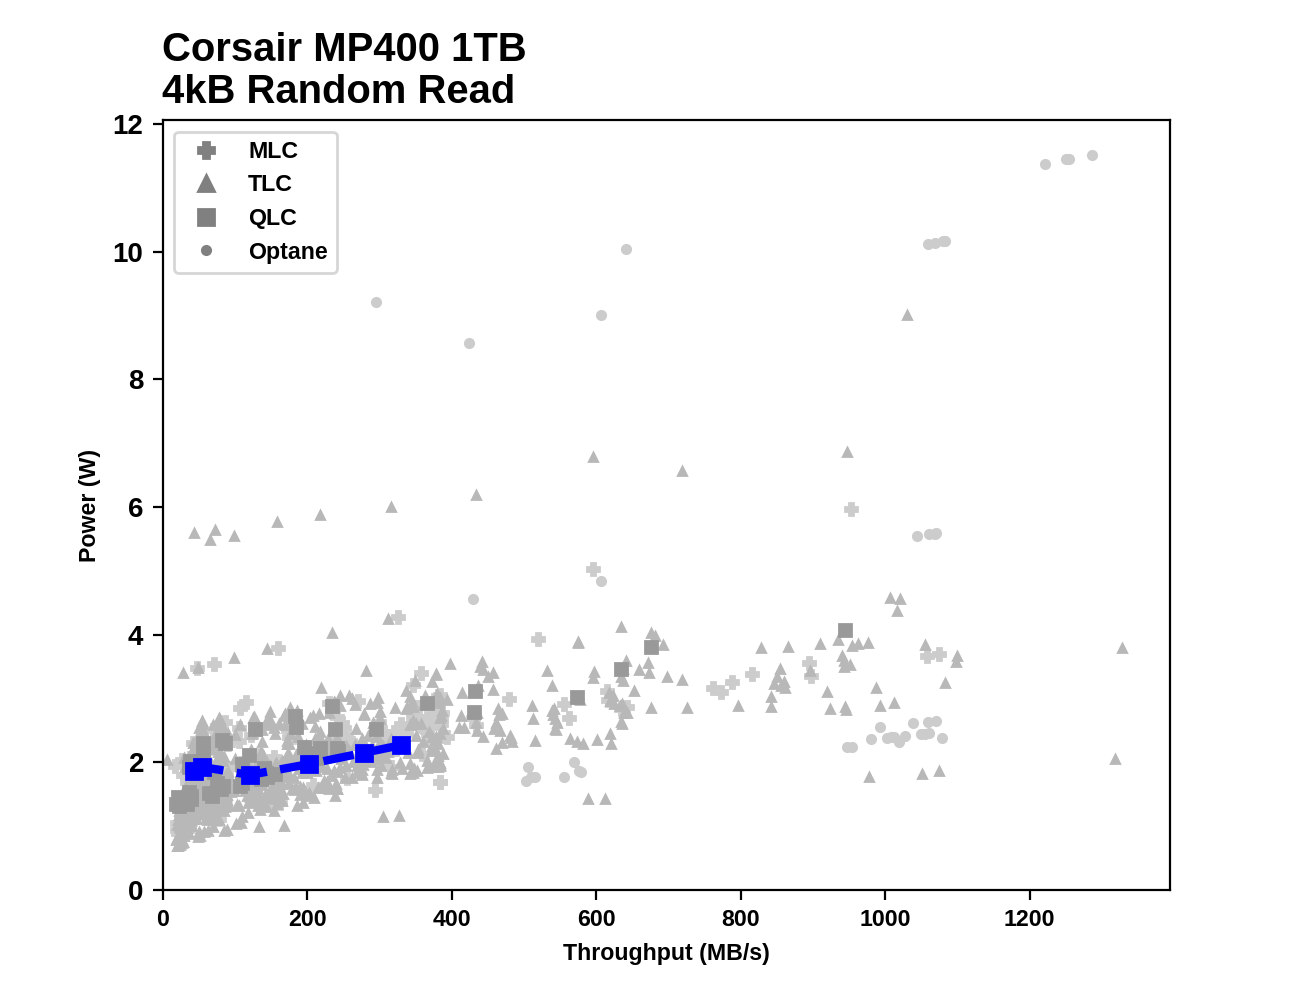
Plotting power and performance against our entire library of benchmark results shows that—for better or for worse—the Corsair MP400 doesn't stand out from the crowd or break new ground. The random read performance stays entirely within the range of SATA drives. Random and sequential writes make some use of PCIe performance, but don't come close to saturating the PCIe 3 x4 interface. The sequential read performance does almost make it to 3GB/s at higher queue depths, but it isn't able to fully saturate the PCIe interface the way the 8TB Sabrent Rocket Q can.
 |
|||||||||
| Random Read | |||||||||
| Random Write | |||||||||
| Sequential Read | |||||||||
| Sequential Write | |||||||||
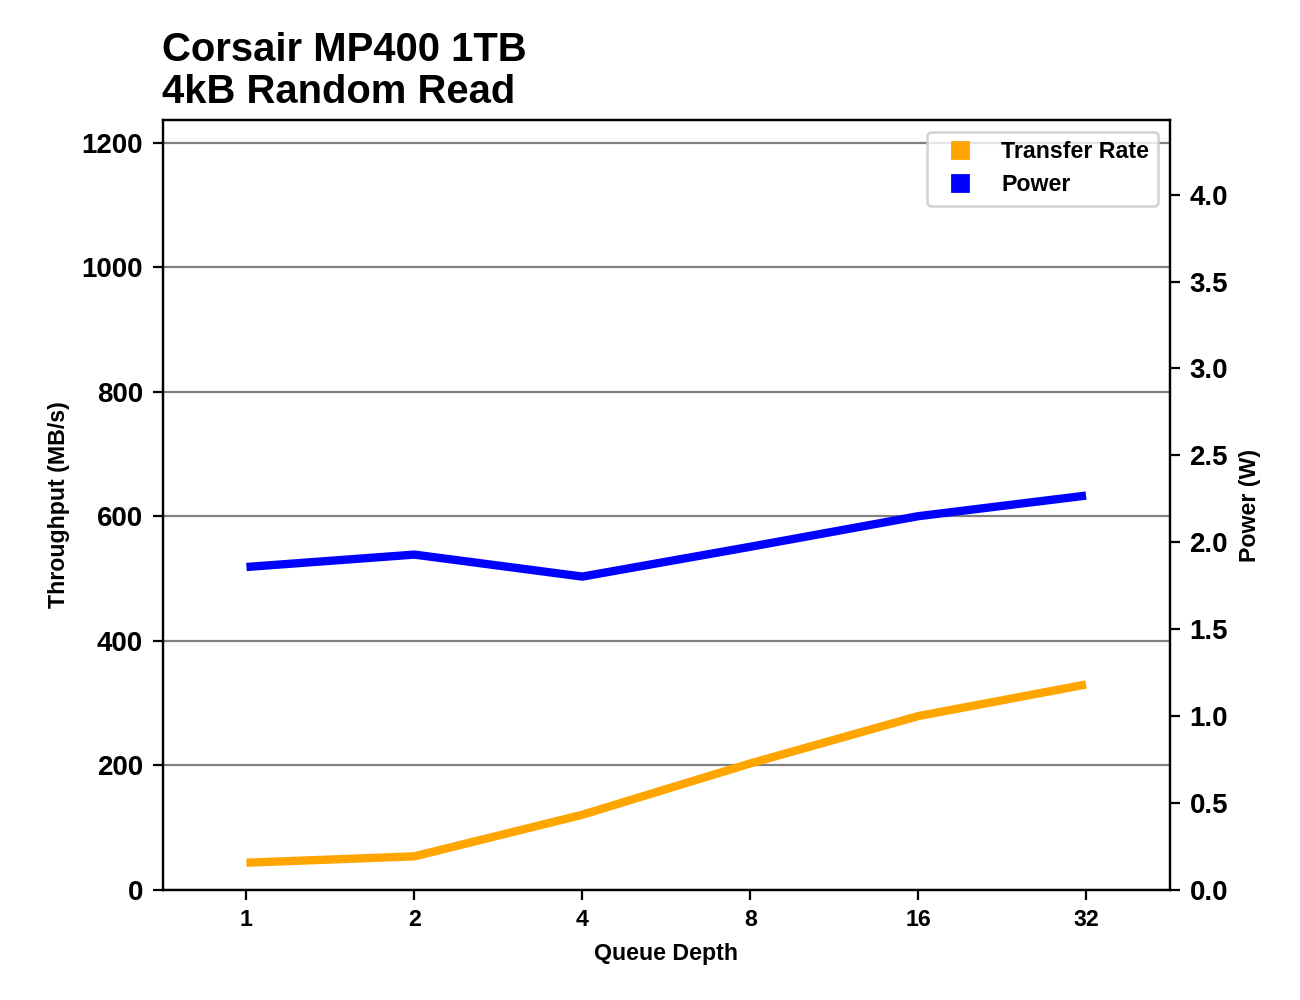
Digging into how performance and power scale with increasing queue depths reveals no particular surprises for the Corsair MP400. The biggest discrepancies with the 8TB Sabrent Rocket Q are for random reads and sequential writes: more flash allows the 8TB drive to continue scaling up random read performance after the 1TB MP400 is starting to reach saturation, and the larger SLC cache for the 8TB drive allows higher and more consistent sequential write performance.


75 Comments
View All Comments
Spunjji - Monday, December 14, 2020 - link
Yes, the drive is absolutely fine for its intended use case and completely inappropriate when used in ways which were not intended (and where its performance would be miserable anyway). 🥱In terms of my usage, for example, it's less "almost disposable" and more "extremely unlikely to wear out before it becomes useless in what will be my current system 10-15 years from now".
zdz - Friday, December 11, 2020 - link
Don't need to look at Samsung. Corsair MP500 1 TB (previous generation model) had 1700 TBW. Eight times more. Today's drive are becoming creap.zdz - Friday, December 11, 2020 - link
I meant mp510, sorry.Makaveli - Saturday, December 12, 2020 - link
Yup the Corsair MP600 1TB which is based on the E16 controller is rated for 1800TBW.Maverick009 - Friday, December 11, 2020 - link
You are talking about 2 similarly but differently marketed drives, the Samsung 860 EVO is a step up or step down from QLC drives depending on how you look at it. The actual 200TBW or 600TBW is based slightly on warranty, data written to drive, along with a few other metrics, but in majority of cases an SSDs life will last several years to decades before it gives out. Well past the purchase date and in some cases past your lifetime.GeoffreyA - Saturday, December 12, 2020 - link
Using Kristian's 850 Evo calculations as a guide, I got the following values, assuming a 1,000 p/e cycle for QLC on a 1 TB drive:20 GB/day (with 1.5x write amp) == 93.52 years
50 GB/day (1.5x w.a.) == 37.4 y
100 GB/day (3x w.a.) == 9.35 y
Hopefully, I didn't muck it all up :)
Spunjji - Monday, December 14, 2020 - link
Nice! Looks like it would be perfectly suitable for the lower-end users that QLC drives are aimed at.But hey, number go down, so all the NAND ranters have a sad.
GeoffreyA - Tuesday, December 15, 2020 - link
I'm sure the Fact Rewriting Squad can work wonders with those values ;)joesiv - Monday, December 14, 2020 - link
Good idea using P/E cycles.Just remember, OS writes != NAND writes.
There are other factors that will increase the WAF (Write Amplification Factor).
It's totally not uncommon to have a WAF of 2x, but if there are bugs, or firmwares too focused on speed or particular usage scenarios, the WAF can be much much higher.
Basically, it needs to be tested.
SMART data may provide this for you, look at your Average Nand writes.
If you're at 10, then you're 1/100th through your 1000 P/E cycles. You can calculate out how many GB/TB's you've used by using the life expecancy the manufactuers advertise (200TB?), divided by that ratio, to find actual NAND writes (if the SMART CTL isn't giving it to you)
Good luck!
GeoffreyA - Tuesday, December 15, 2020 - link
Had a crack at this earlier. Attributes were a bit obscure, but after some research, took value 241, LBAs written, and multiplied by 512 to work out bytes. From there, got about 2.28 TB or so, which squares with the ~2.4 TB value in Hwinfo. It's an 860 Evo 500 GB, just over a year old. I hardly play games or anything any more, so that's why the writes are so low. Also, round about May, put in a mechanical drive that was just collecting dust. It works well for storing films. Before that, space was a battle on the SSD.