The Corsair MP400 1TB QLC NVMe SSD: A Quick Review
by Billy Tallis on December 11, 2020 2:00 PM ESTMixed IO Performance
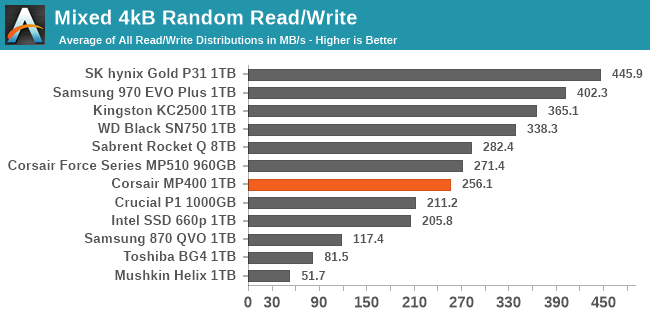
Our tests of mixed read/write IO vary the workload from pure reads to pure writes at 10% increments. Each mix is tested for up to 1 minute or 32GB of data transferred. The mixed random IO test uses a queue depth of 4 while the mixed sequential IO test uses a queue depth of 1. The tests are confined to a 64GB span of the drive, and the drive is given up to one minute of idle time in between each mix tested.
 |
|||||||||
| Mixed Random IO | Mixed Sequential IO | ||||||||
The QLC NVMe drives like the Corsair MP400 have a clear advantage over the DRAMless TLC drives for mixed read/write workloads. This is particularly pronounced for the mixed random IO test, where the DRAMless TLC drives are even slower than the QLC SATA drive. On the mixed sequential IO test, those DRAMless TLC drives can compete with some of the slower QLC NVMe drives, but the 8-channel Phison E12 controller used in the Corsair MP400 and Sabrent Rocket Q helps them stay ahead as the faster budget NVMe strategy.
 |
|||||||||
| Mixed Random IO | Mixed Sequential IO | ||||||||
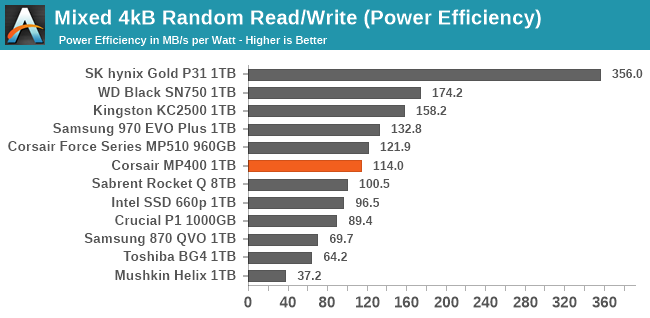
The budget NVMe drives all have worse power efficiency during the mixed IO tests than any of the high-end options, but the Corsair MP400 has some of the best efficiency scores within the budget NVMe segment. The 8TB Sabrent Rocket Q trails behind the 1TB MP400 because of the extra power draw of so many NAND dies.
 |
|||||||||
| Mixed Random IO | |||||||||
| Mixed Sequential IO | |||||||||
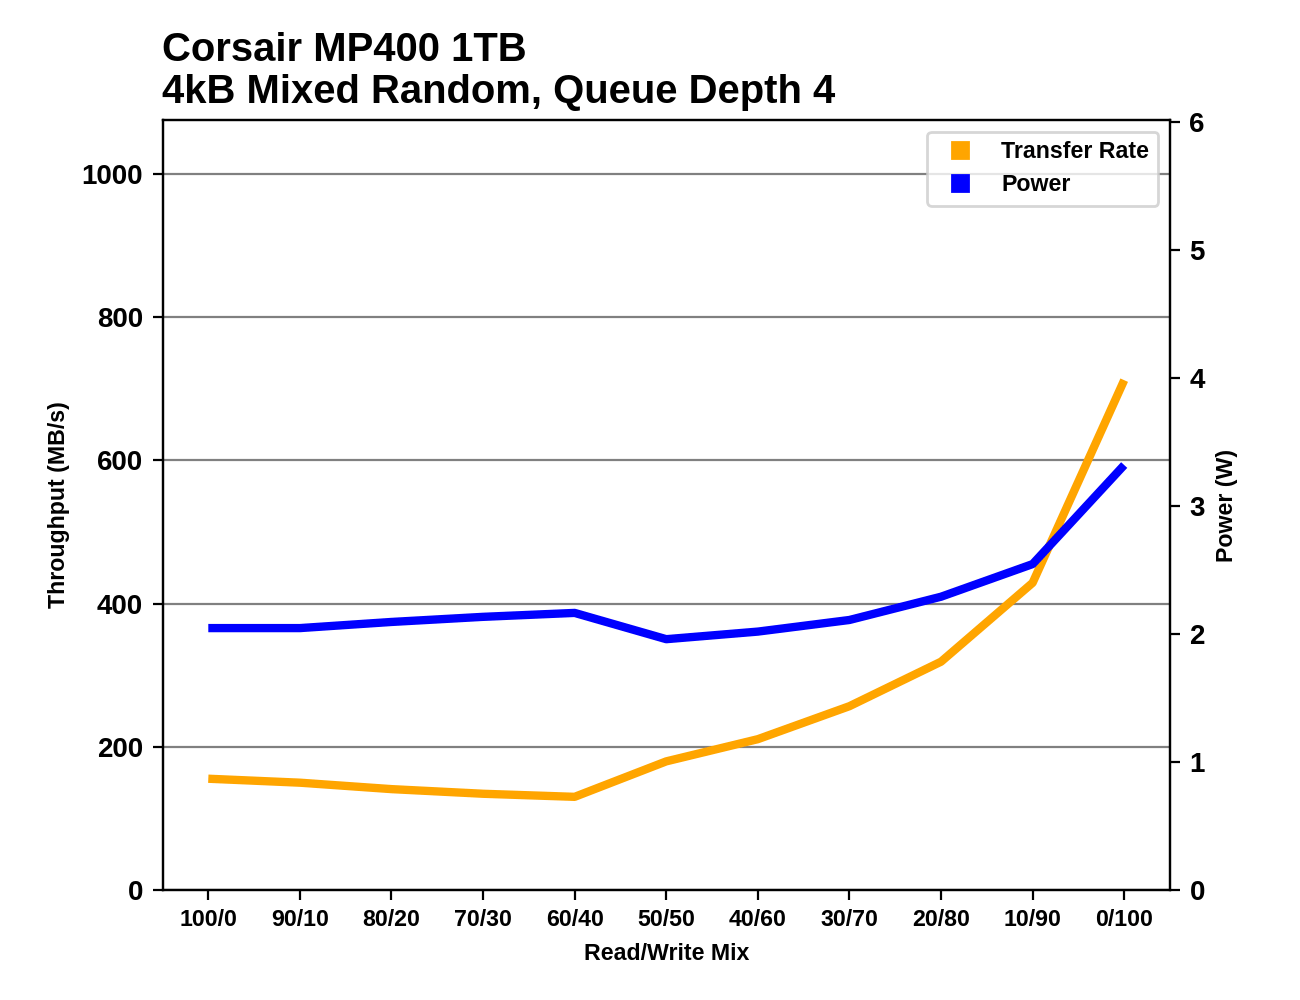
The Corsair MP400's performance curves through the mixed random and sequential IO tests generally resemble what we saw for the Sabrent Rocket Q. On the mixed sequential IO test, the 8TB Rocket Q generally maintained a clear performance lead over the 1TB MP400 (at the cost of much higher power draw), but their performance scaling across the random IO test is very similar. The overall shape of the performance curves for these QLC drives has a lot more in common with mainstream TLC drives than it does with the entry-level DRAMless TLC drives; the QLC drives are slower than mainstream TLC drives, but not as obviously limited as the DRAMless drives.
Idle Power Measurement
SATA SSDs are tested with SATA link power management disabled to measure their active idle power draw, and with it enabled for the deeper idle power consumption score and the idle wake-up latency test. Our testbed, like any ordinary desktop system, cannot trigger the deepest DevSleep idle state.
Idle power management for NVMe SSDs is far more complicated than for SATA SSDs. NVMe SSDs can support several different idle power states, and through the Autonomous Power State Transition (APST) feature the operating system can set a drive's policy for when to drop down to a lower power state. There is typically a tradeoff in that lower-power states take longer to enter and wake up from, so the choice about what power states to use may differ for desktop and notebooks, and depending on which NVMe driver is in use. Additionally, there are multiple degrees of PCIe link power savings possible through Active State Power Management (APSM).
We report three idle power measurements. Active idle is representative of a typical desktop, where none of the advanced PCIe link or NVMe power saving features are enabled and the drive is immediately ready to process new commands. Our Desktop Idle number represents what can usually be expected from a desktop system that is configured to enable SATA link power management, PCIe ASPM and NVMe APST, but where the lowest PCIe L1.2 link power states are not available. The Laptop Idle number represents the maximum power savings possible with all the NVMe and PCIe power management features in use—usually the default for a battery-powered system but rarely achievable on a desktop even after changing BIOS and OS settings. Since we don't have a way to enable SATA DevSleep on any of our testbeds, SATA drives are omitted from the Laptop Idle charts.
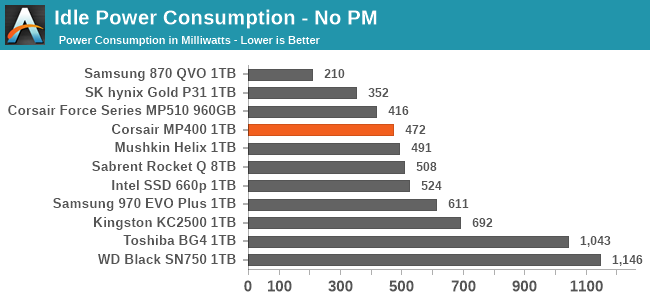
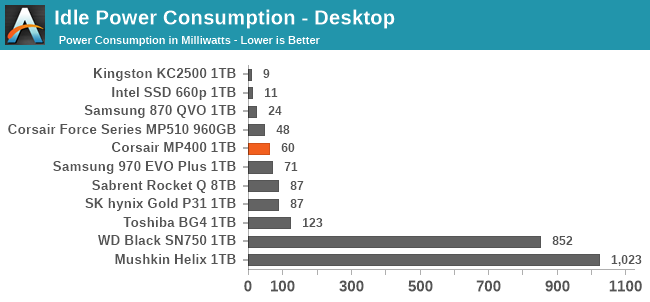
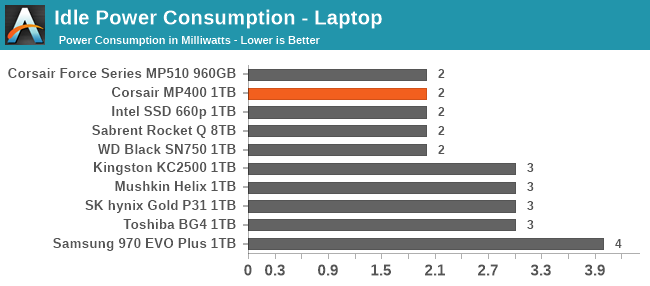
The Corsair MP400 identifies itself as having the same idle power management capabilities as the Sabrent Rocket Q, and significantly lower maximum power draw in its active power states than the very pessimistic figures our 8TB Rocket Q sample provides to the OS.
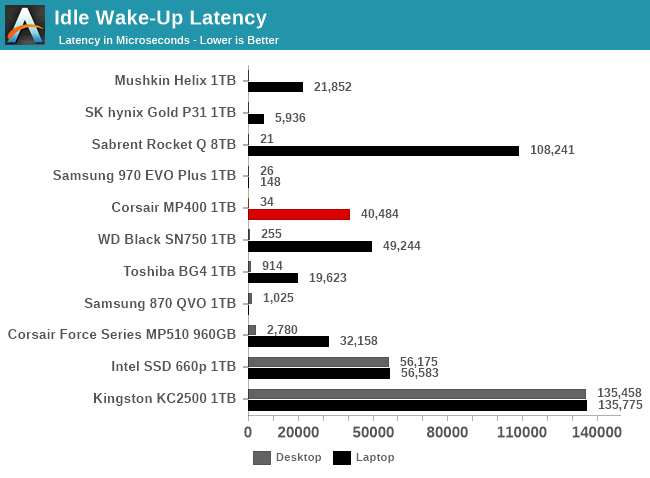
The active and desktop idle power values we measured for the MP400 are a bit lower than for the Rocket Q 8TB, which is to be expected given the lower part count on the 1TB MP400. Waking up from the intermediate desktop idle state is extremely quick, but waking from the deepest sleep state is just a bit on the slow side.


75 Comments
View All Comments
ballsystemlord - Friday, December 11, 2020 - link
I have seen normal people burn through 150TBW in about 2m. One of them used folding@home to help with the pandemic (IDK if that program was the cause). I forget what the other was doing.Therefore, I also support the demand for higher endurance flash.
Ithaqua - Friday, December 11, 2020 - link
150TB in 2 minutes? That is some massive write speeds.Unashamed_unoriginal_username_x86 - Saturday, December 12, 2020 - link
1250GB/s or 157 PCIe 6.0 lanes' bandwidthSamus - Sunday, December 13, 2020 - link
I just hopped in my DeLorean to check and this is the norm in 2029!ballsystemlord - Saturday, December 12, 2020 - link
2 months, silly. ;)Gigaplex - Wednesday, December 16, 2020 - link
Lower case m as a unit of time signifies minutes, not months, silly.Beaver M. - Saturday, December 12, 2020 - link
That sure as hell is not normal.My drive is 5 years old and only has 62 TBW. And its the only drive in my PC, so everything is done on it, 12 to 16 hours a day.
Spunjji - Monday, December 14, 2020 - link
Seconding this; whatever they were doing was not "normal".joesiv - Monday, December 14, 2020 - link
Or the firmware is at fault. Bugs in SSD firmwares happen and can cause very bad write efficiencies. I saw the same thing at work. Same workload given to 5 different brand/model drives, one drive ran through 1% of it's life expectancy every day, others were fine.rrinker - Monday, December 14, 2020 - link
I have an 850 EVO that was the C drive in my old computer, now in as the D drive in my new one - I looked it up, I've had it closer to 6 years than 5, bought early 2015. As the D drive in this computer, it is my download drive, torrent temp storage, and basically all around junk collector drive - and it only has 16.2 TBW. I typically download to this drive, then copy things to my server, but really the most changing stuff besides the OS are on this drive. I don't do video production sort of tasks.