USB 3.2 Gen 2x2 State of the Ecosystem Review: Where Does 20Gbps USB Stand in 2020?
by Ganesh T S on October 5, 2020 10:30 AM EST- Posted in
- Storage
- SSDs
- Western Digital
- SanDisk
- ASMedia
- USB 3.2 Gen 2x2
Worst-Case Consistency, Thermals, and Power Consumption
The performance of the drives in various real-world access traces as well as synthetic workloads was brought out in the preceding sections. We also looked at the performance consistency for these cases. Power users may also be interested in performance consistency under worst-case conditions, as well as drive power consumption. The latter is also important when used with battery powered devices such as notebooks and smartphones. We analyze each of these in detail below.
Flash-based storage devices tend to slow down in unpredictable ways when subject to a large number of small-sized random writes. Many benchmarks use that scheme to pre-condition devices prior to the actual testing in order to get a worst-case representative number. Fortunately, such workloads are uncommon for direct-attached storage devices, where workloads are largely sequential in nature. Use of SLC caching as well as firmware caps to prevent overheating may cause drop in write speeds when a flash-based DAS device is subject to sustained sequential writes.
Our Sequential Writes Performance Consistency Test configures the device as a raw physical disk (after deleting configured volumes). A fio workload is set up to write sequential data to the raw drive with a block size of 128K and iodepth of 32 to cover 90% of the drive capacity. The internal temperature is recorded at either end of the workload, while the instantaneous write data rate and cumulative total write data amount are recorded at 1-second intervals.
| Sequential Write to 90% of Disk Capacity - Performance Consistency |
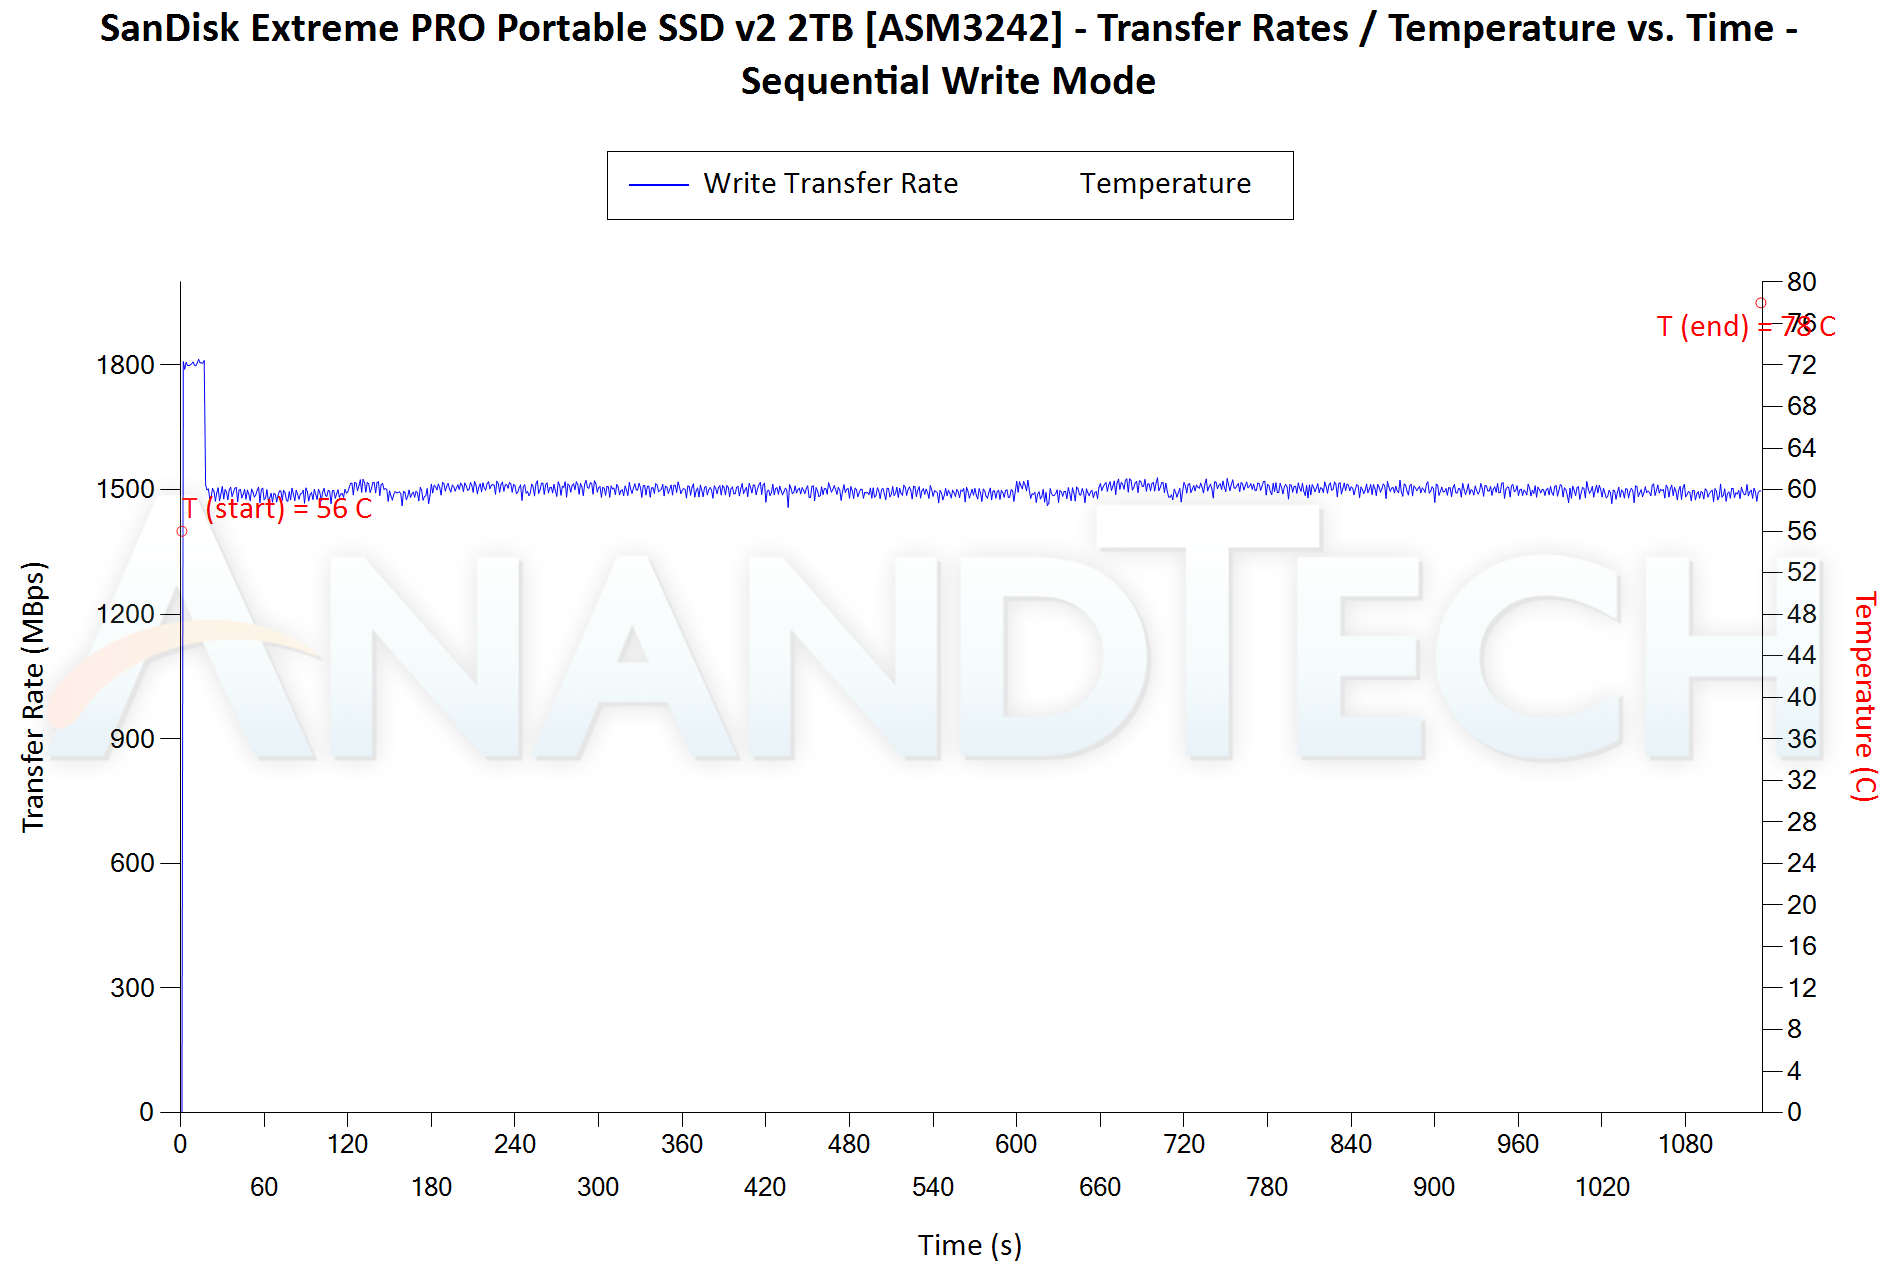 |
Our primary focus is on the performance in the Haswell testbed. The Extreme PRO v2 starts off around 1800 MBps for up to 30GB of continuous writes before dropping down to around 1500 MBps for the remainder of the workload. There is a 22C rise from 56C to 78C in this process. The P50 also starts off similarly, sustaining around 1800 MBps for 13GB of continuous writes before moving down to 1400 MBps. However, the worrisome part is the drops to sub-50 MBps for 3-5 seconds at a time before recovering for around 10-15 seconds in the latter half of the workload. This symptom is seen after around 610GB of continuous writes. We do not see this problem when the drive is connected via the eGFX enclosure - however, the fill rate is around 1280 MBps consistently for the full duration of the workload in that configuration. With the USB 3.2 Gen 2 port of Alpine Ridge, the P50 is again consistent around 850 MBps. The performance of the other drives in other configurations are along expected lines, as can be observed in the above graphs.
Bus-powered devices can configure themselves to operate within the power delivery constraints of the host port. While Thunderbolt 3 ports are guaranteed to supply up to 15W for client devices, USB 3.0 ports are guaranteed to deliver only 4.5W (900mA @ 5V). In this context, it is interesting to have a fine-grained look at the power consumption profile of the various drives. Using the Plugable USBC-TKEY, the bus power consumption of the drives was tracked while processing the CrystalDiskMark workloads (separated by 30s intervals). The graphs below plot the instantaneous bus power consumption against time, while singling out the maximum and minimum power consumption numbers.
| Drive Power Consumption - CrystalDiskMark Workloads |
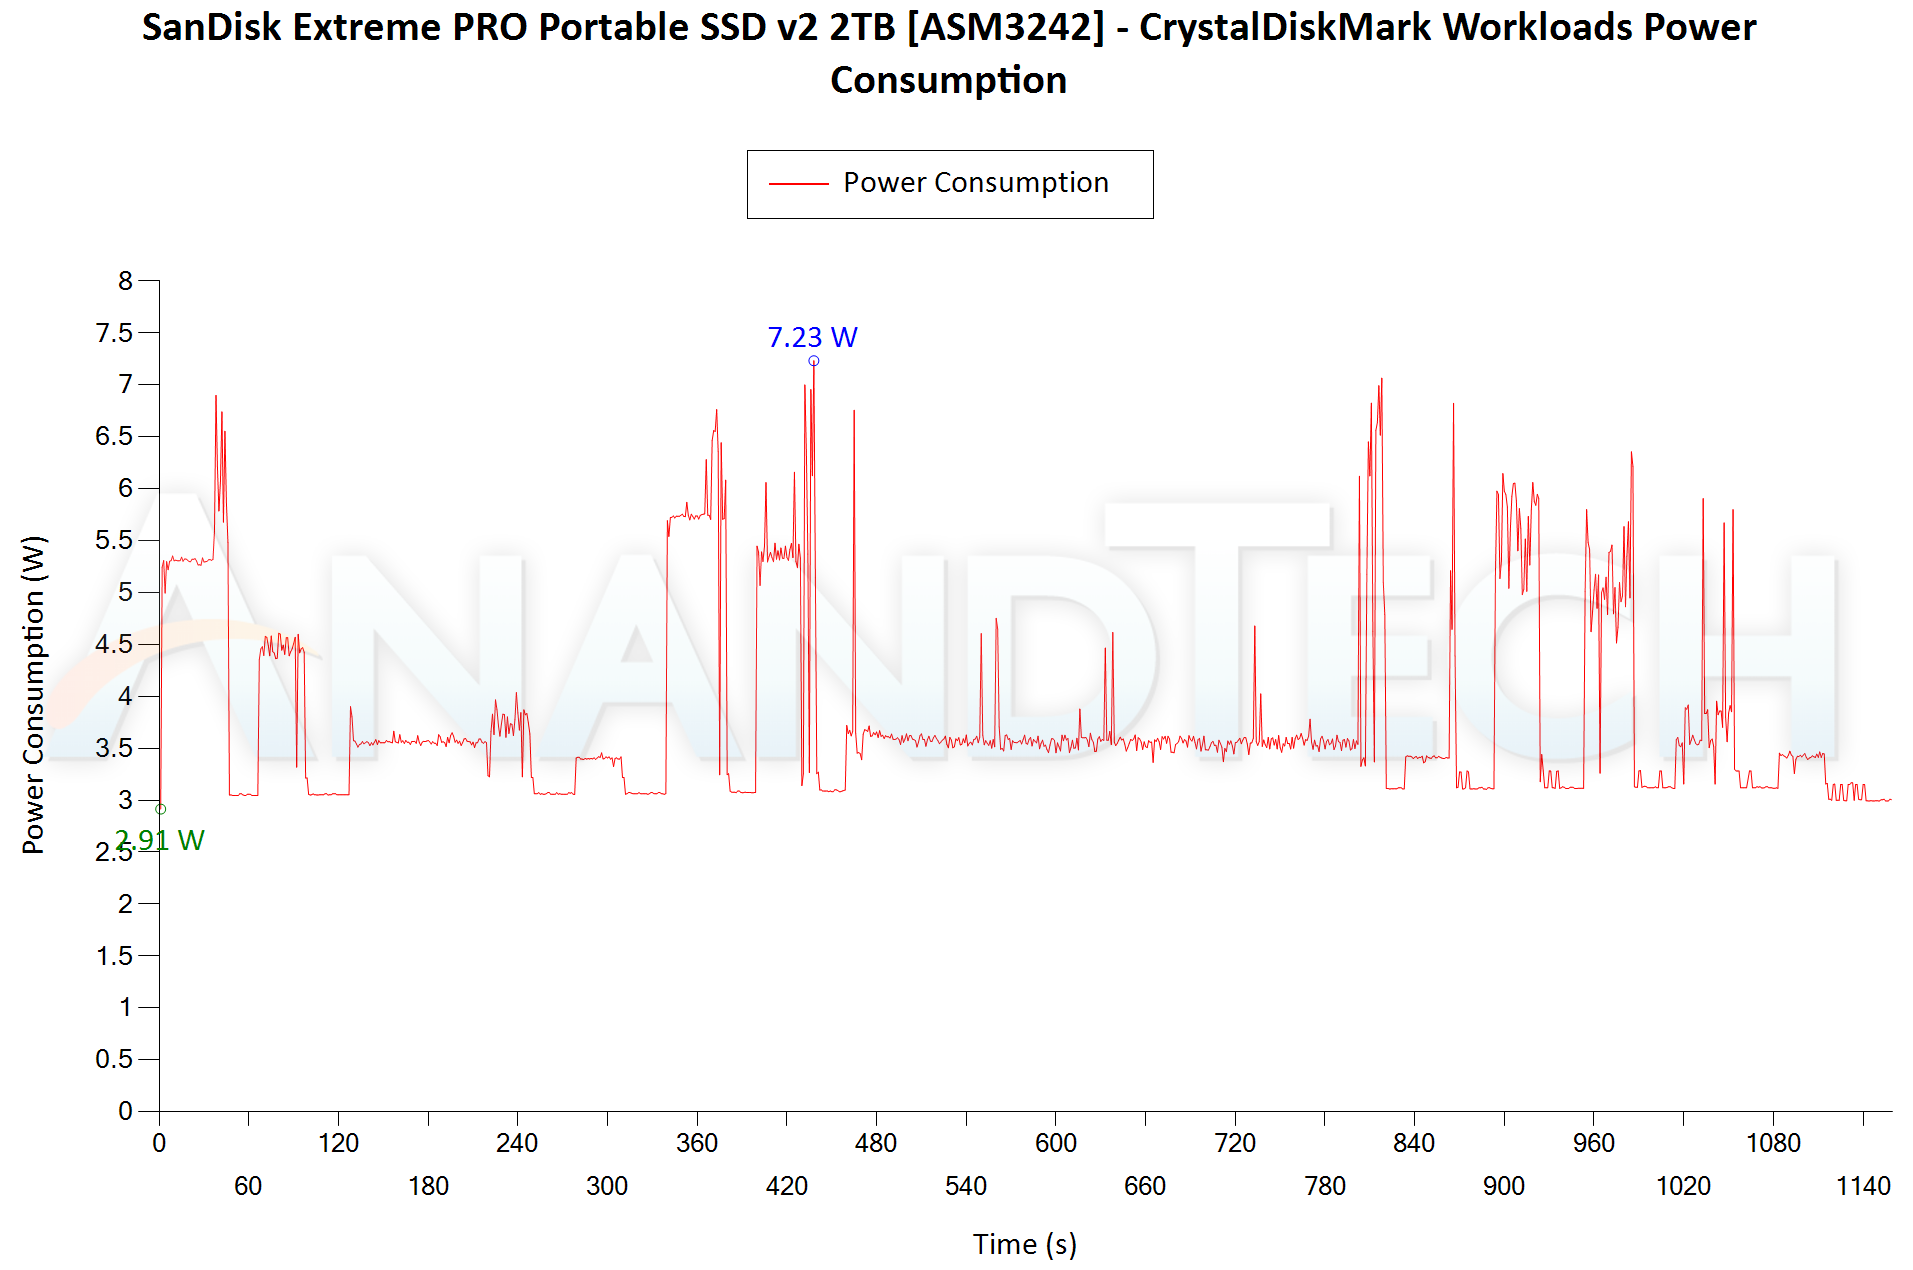 |
The system lock-up during the RND4K Q32T16 workload component is evident in the above graphs, where the power consumption tracker on a different machine continues to keep tracking the power numbers while the system and the drive itself are frozen for all practical purposes. The most interesting cases for the above set are with the testbed demonstrating maximum performance - the Haswell testbed. The Extreme PRO v2 has a peak of 7.23W, and a minimum of 2.91W. The corresponding numbers for the P50 are 8.13W and 3.17W. Interestingly, we see the peak for the Extreme PRO v2 and the P50 with the eGFX configuration - 7.41W and 8.19W respectively. Using the USB SuperSpeed 10Gbps port, the drives run a bit cooler - Extreme PRO v2 peaks at 6.59W, while the P50 peaks at 7.39W. It must be noted that the P50 comes with a status LED (which glows white when the drive is connected), while the Extreme PRO v2 doesn't.


81 Comments
View All Comments
epobirs - Wednesday, October 7, 2020 - link
This was tried and rejected by the world already, under the name SATA Express. A whole generation of motherboards shipped with SATA Express ports but nobody made any drives of any sort to use with the port. (IIRC, WD had a demo at Computex one year.) The closest I ever came to using a SATA Express port for anything was the clever ASrock adapter that let you repurpose the port to create a pair of USB 3.1 ports, Type A and C with 10Gb/s support, that went into a front drive bay.Once NVMe caught on it just didn't make much sense to pursue a direct successor to SATA.
https://en.wikipedia.org/wiki/SATA_Express
Hrunga_Zmuda - Tuesday, October 13, 2020 - link
Exactly.StormyParis - Monday, October 5, 2020 - link
Performance is one thing, and I understand it's the primary concern in some cases.In most cases though, compatibility not performance is the main issue, and we run into 2 problems:
1- it's hard to know what *should* work. A USB-C port doesn't mean anything at all by itself, there's not even a color code as a quick hint. Any consumer tech that requires to RTFM is failing at a very basic level.
2- even stuff that should work sometimes doesn't. Apparently USB-PD charging on MacBooks works much better on one side than on the other. I've seen a lot of issues with video, even simple storage/LAN stuff.
The goal of USB is laudable. The way they're going at it is laughable.
drexnx - Monday, October 5, 2020 - link
yeah, USB used to mean it just worked, didn't have to think about it or read anything. Literally plug and play.now? no clue, unless the mfg puts iconography to let you know what each port can do.
imaheadcase - Monday, October 5, 2020 - link
Even with speeds it varies so wildly by device its silly. The real only advantage i found with a SSD for portable drive is the size and weight is better. Performance is Meh, because most people aren't using it for own devices so much as plugging it into someone elses. I've seen top selling drives that will barely get usb 2.0, and even then the read/write to usb speed is insanely different between devices.imaheadcase - Monday, October 5, 2020 - link
I forgot to mention that even cables mater so much, i'm not talking about scam monster cable stuff, i'm talking just even same brand to brand, can get a bulk 20 pack of usb-c cables, and each one could be different in speed.BeethovensCat - Monday, October 5, 2020 - link
Agree!! A complete joke! Have Patriot and a Sandisk SSD and they don't work with the same USB C cable. How can USB have come to this?drexnx - Monday, October 5, 2020 - link
this is really getting back to the dark ages of RS232 where there were different baud rates for different peripherals, now that I think about itdontlistentome - Monday, October 5, 2020 - link
I'll bite. Bit of a correction on diagram, more complexity needed.USB 1.0 was 1.5Mbps, USB 1.1 was 12Mbps
repoman27 - Monday, October 5, 2020 - link
Nope. USB 1.0 defined both low-speed 1.5 Mbit/s and full-speed 12 Mbit/s signaling. It just sucked, which is why 1.1 was released to fix a bunch of issues that were encountered in real-world implementations.