Intel’s Tiger Lake 11th Gen Core i7-1185G7 Review and Deep Dive: Baskin’ for the Exotic
by Dr. Ian Cutress & Andrei Frumusanu on September 17, 2020 9:35 AM EST- Posted in
- CPUs
- Intel
- 10nm
- Tiger Lake
- Xe-LP
- Willow Cove
- SuperFin
- 11th Gen
- i7-1185G7
- Tiger King
CPU Performance: Simulation and Science
Simulation and Science have a lot of overlap in the benchmarking world, however for this distinction we’re separating into two segments mostly based on the utility of the resulting data. The benchmarks that fall under Science have a distinct use for the data they output – in our Simulation section, these act more like synthetics but at some level are still trying to simulate a given environment.
DigiCortex v1.35: link
DigiCortex is a pet project for the visualization of neuron and synapse activity in the brain. The software comes with a variety of benchmark modes, and we take the small benchmark which runs a 32k neuron/1.8B synapse simulation, similar to a small slug.
The results on the output are given as a fraction of whether the system can simulate in real-time, so anything above a value of one is suitable for real-time work. The benchmark offers a 'no firing synapse' mode, which in essence detects DRAM and bus speed, however we take the firing mode which adds CPU work with every firing.
I reached out to the author of the software, who has added in several features to make the software conducive to benchmarking. The software comes with a series of batch files for testing, and we run the ‘small 64-bit nogui’ version with a modified command line to allow for ‘benchmark warmup’ and then perform the actual testing.

The software originally shipped with a benchmark that recorded the first few cycles and output a result. So while fast multi-threaded processors this made the benchmark last less than a few seconds, slow dual-core processors could be running for almost an hour. There is also the issue of DigiCortex starting with a base neuron/synapse map in ‘off mode’, giving a high result in the first few cycles as none of the nodes are currently active. We found that the performance settles down into a steady state after a while (when the model is actively in use), so we asked the author to allow for a ‘warm-up’ phase and for the benchmark to be the average over a second sample time.
For our test, we give the benchmark 20000 cycles to warm up and then take the data over the next 10000 cycles seconds for the test – on a modern processor this takes 30 seconds and 150 seconds respectively. This is then repeated a minimum of 10 times, with the first three results rejected.
We also have an additional flag on the software to make the benchmark exit when complete (which is not default behavior). The final results are output into a predefined file, which can be parsed for the result. The number of interest for us is the ability to simulate this system in real-time, and results are given as a factor of this: hardware that can simulate double real-time is given the value of 2.0, for example.
The final result is a table that looks like this:
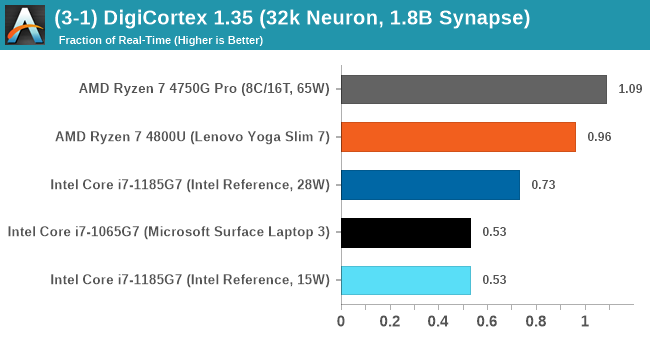
DigiCortex likes the 8-core AMD processors, but doesn't seem to like the LPDDR4 memory over the standard DDR4.
Dwarf Fortress 0.44.12: Link
Another long standing request for our benchmark suite has been Dwarf Fortress, a popular management/roguelike indie video game, first launched in 2006 and still being regularly updated today, aiming for a Steam launch sometime in the future.
Emulating the ASCII interfaces of old, this title is a rather complex beast, which can generate environments subject to millennia of rule, famous faces, peasants, and key historical figures and events. The further you get into the game, depending on the size of the world, the slower it becomes as it has to simulate more famous people, more world events, and the natural way that humanoid creatures take over an environment. Like some kind of virus.
For our test we’re using DFMark. DFMark is a benchmark built by vorsgren on the Bay12Forums that gives two different modes built on DFHack: world generation and embark. These tests can be configured, but range anywhere from 3 minutes to several hours. We’ve tested a large world generation scenario:
- Large, a 257x257 world with 550 years, 40 civilizations and 10 megabeasts
DFMark outputs the time to run any given test, so this is what we use for the output. We loop the large test for as many times in an hour.
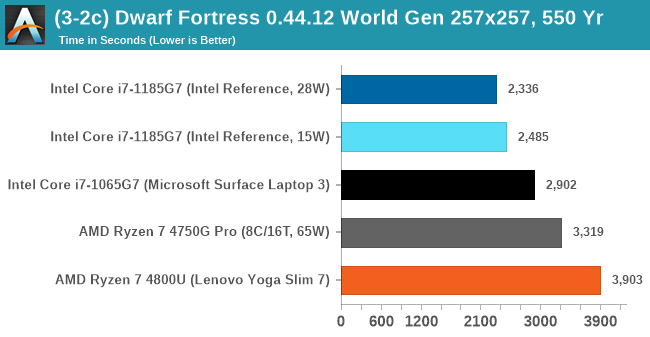
Intel's hardware likes Dwarf Fortress. It is primarily single threaded, and so a high IPC and a high frequency is what matters here.
Dolphin v5.0 Emulation: Link
Many emulators are often bound by single thread CPU performance, and general reports tended to suggest that Haswell provided a significant boost to emulator performance. This benchmark runs a Wii program that ray traces a complex 3D scene inside the Dolphin Wii emulator. Performance on this benchmark is a good proxy of the speed of Dolphin CPU emulation, which is an intensive single core task using most aspects of a CPU. Results are given in seconds, where the Wii itself scores 1051 seconds.
The Dolphin software has the ability to output a log, and we obtained a version of the benchmark from a Dolphin developer that outputs the display into that log file. The benchmark when finished will automatically try to close the Dolphin software (which is not normal behavior) and brings a pop-up on display to confirm, which our benchmark script can detects and remove. The log file is fairly verbose, so the benchmark script iterates through line-by-line looking for a regex match in line with the final time to complete.
The final result is a table that looks like this:
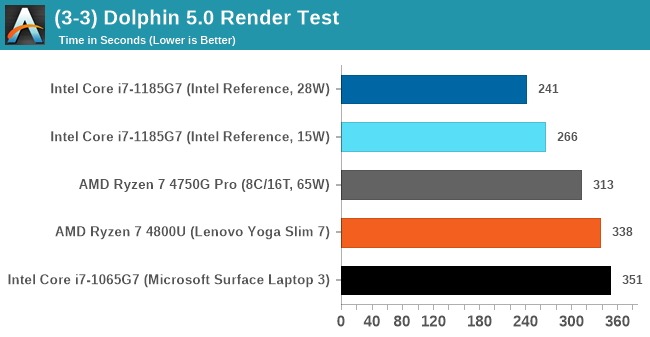
More often than not Intel's processors are the ones to choose for this sort of emulation - AMD catched up with Zen 2, but it would appear that Tiger Lake makes another leap forward.
CPU Tests: Science
In this version of our test suite, all the science focused tests that aren’t ‘simulation’ work are now in our science section. This includes Brownian Motion, calculating digits of Pi, molecular dynamics, and for the first time, we’re trialing an artificial intelligence benchmark, both inference and training, that works under Windows using python and TensorFlow. Where possible these benchmarks have been optimized with the latest in vector instructions, except for the AI test – we were told that while it uses Intel’s Math Kernel Libraries, they’re optimized more for Linux than for Windows, and so it gives an interesting result when unoptimized software is used.
3D Particle Movement v2.1: Non-AVX and AVX2/AVX512
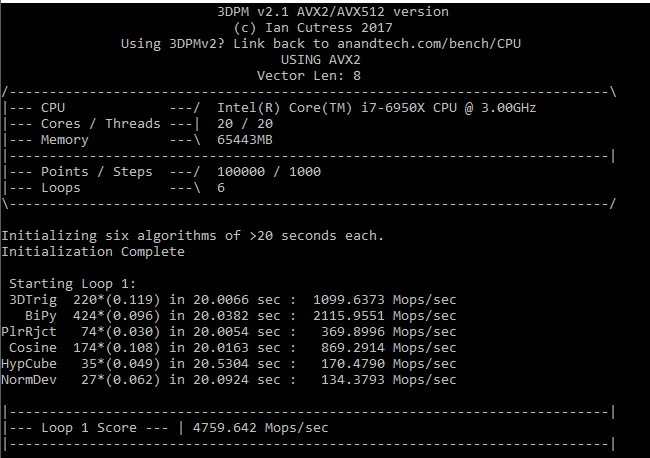
This is the latest version of the benchmark designed to simulate semi-optimized scientific algorithms taken directly from my doctorate thesis. This involves randomly moving particles in a 3D space using a set of algorithms that define random movement. Version 2.1 improves over 2.0 by passing the main particle structs by reference rather than by value, and decreasing the amount of double->float->double recasts the compiler was adding in.
The initial version of v2.1 is a custom C++ binary of my own code, flags are in place to allow for multiple loops of the code with a custom benchmark length. By default this version runs six times and outputs the average score to the console, which we capture with a redirection operator that writes to file.
For v2.1, we also have a fully optimized AVX2/AVX512 version, which uses intrinsics to get the best performance out of the software. This was done by a former Intel AVX-512 engineer who now works elsewhere. According to Jim Keller, there are only a couple dozen or so people who understand how to extract the best performance out of a CPU, and this guy is one of them. To keep things honest, AMD also has a copy of the code, but has not proposed any changes.
The final result is a table that looks like this:
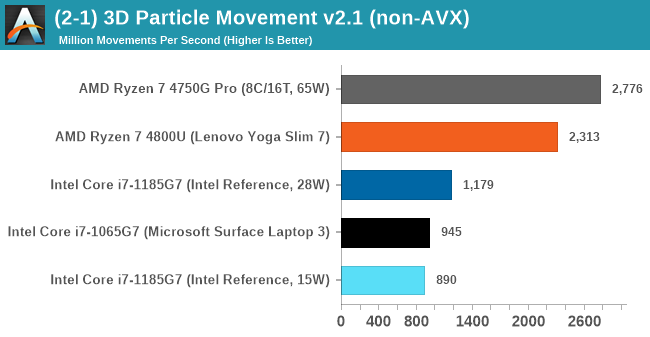
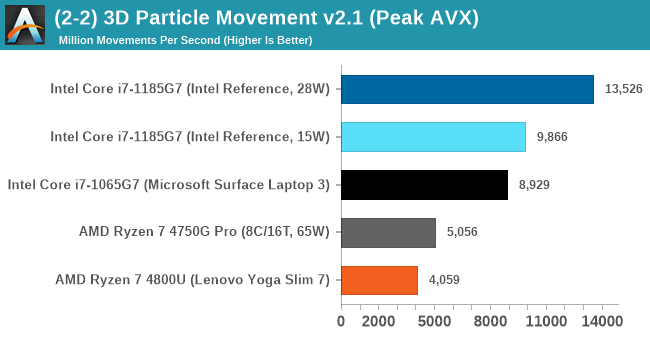
For the non-AVX compute, the eight cores of the AMD processors are ahead, however AVX-512 is a powerful tool in the right hands, with the 1185G7 offering 2x-3x performance for the same power than AMD.
y-Cruncher 0.78.9506: www.numberworld.org/y-cruncher
If you ask anyone what sort of computer holds the world record for calculating the most digits of pi, I can guarantee that a good portion of those answers might point to some colossus super computer built into a mountain by a super-villain. Fortunately nothing could be further from the truth – the computer with the record is a quad socket Ivy Bridge server with 300 TB of storage. The software that was run to get that was y-cruncher.
Built by Alex Yee over the last part of a decade and some more, y-Cruncher is the software of choice for calculating billions and trillions of digits of the most popular mathematical constants. The software has held the world record for Pi since August 2010, and has broken the record a total of 7 times since. It also holds records for e, the Golden Ratio, and others. According to Alex, the program runs around 500,000 lines of code, and he has multiple binaries each optimized for different families of processors, such as Zen, Ice Lake, Sky Lake, all the way back to Nehalem, using the latest SSE/AVX2/AVX512 instructions where they fit in, and then further optimized for how each core is built.
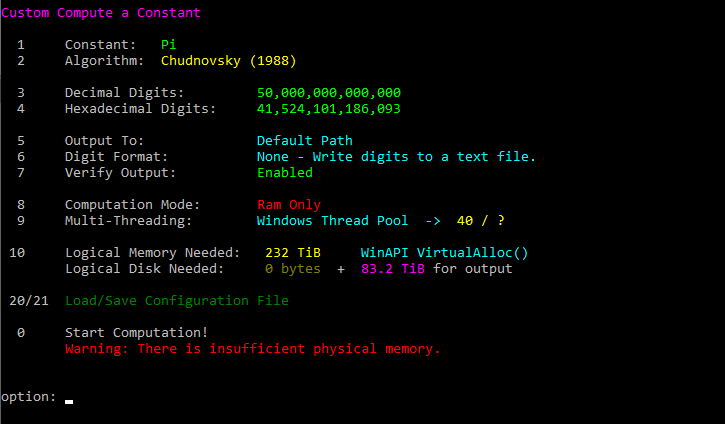
For our purposes, we’re calculating Pi, as it is more compute bound than memory bound.
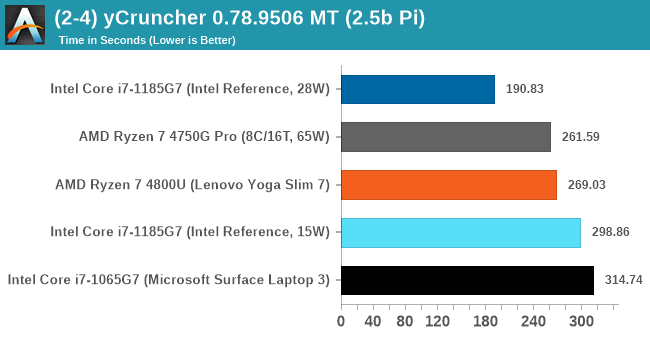
y-Cruncher takes advantage of the extra power available in the 28 W TDP mode, utilizing AVX-512 better than AMD can do with eight cores on AVX2 at 65 W.
NAMD 2.13 (ApoA1): Molecular Dynamics
One of the popular science fields is modelling the dynamics of proteins. By looking at how the energy of active sites within a large protein structure over time, scientists behind the research can calculate required activation energies for potential interactions. This becomes very important in drug discovery. Molecular dynamics also plays a large role in protein folding, and in understanding what happens when proteins misfold, and what can be done to prevent it. Two of the most popular molecular dynamics packages in use today are NAMD and GROMACS.
NAMD, or Nanoscale Molecular Dynamics, has already been used in extensive Coronavirus research on the Frontier supercomputer. Typical simulations using the package are measured in how many nanoseconds per day can be calculated with the given hardware, and the ApoA1 protein (92,224 atoms) has been the standard model for molecular dynamics simulation.
Luckily the compute can home in on a typical ‘nanoseconds-per-day’ rate after only 60 seconds of simulation, however we stretch that out to 10 minutes to take a more sustained value, as by that time most turbo limits should be surpassed. The simulation itself works with 2 femtosecond timesteps.
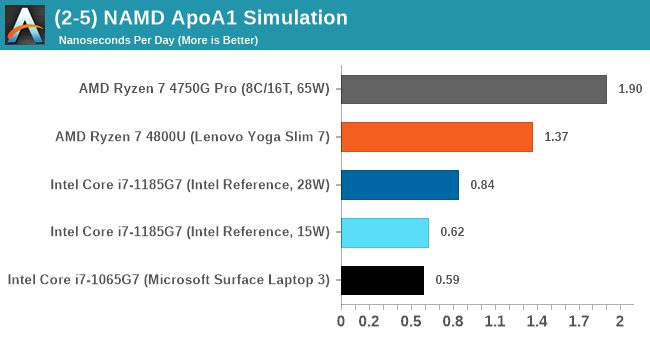
NAMD scales well with cores.
AI Benchmark 0.1.2 using TensorFlow: Link
Finding an appropriate artificial intelligence benchmark for Windows has been a holy grail of mine for quite a while. The problem is that AI is such a fast moving, fast paced word that whatever I compute this quarter will no longer be relevant in the next, and one of the key metrics in this benchmarking suite is being able to keep data over a long period of time. We’ve had AI benchmarks on smartphones for a while, given that smartphones are a better target for AI workloads, but it also makes some sense that everything on PC is geared towards Linux as well.
Thankfully however, the good folks over at ETH Zurich in Switzerland have converted their smartphone AI benchmark into something that’s useable in Windows. It uses TensorFlow, and for our benchmark purposes we’ve locked our testing down to TensorFlow 2.10, AI Benchmark 0.1.2, while using Python 3.7.6 – this was the only combination of versions we could get to work, because Python 3.8 has some quirks.
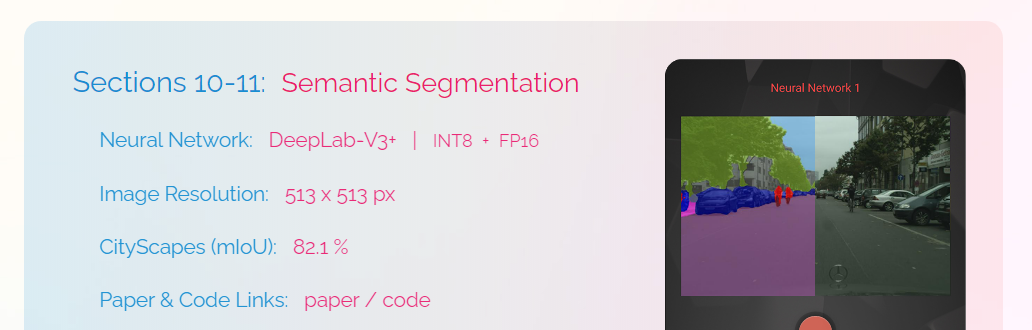
The benchmark runs through 19 different networks including MobileNet-V2, ResNet-V2, VGG-19 Super-Res, NVIDIA-SPADE, PSPNet, DeepLab, Pixel-RNN, and GNMT-Translation. All the tests probe both the inference and the training at various input sizes and batch sizes, except the translation that only does inference. It measures the time taken to do a given amount of work, and spits out a value at the end.
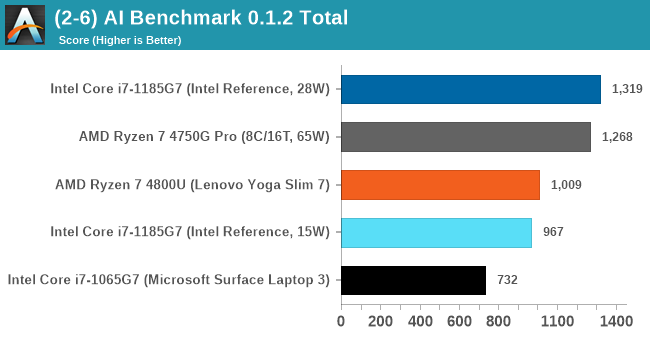
Intel currently has the easier tools for AI acceleration, and the developers here use the Intel Math Kernel Libraries. These libraries aren't to fond of scaling in windows compared to Linux, but we still see a sizeable uplift for Tiger Lake from Ice Lake.


253 Comments
View All Comments
blppt - Saturday, September 26, 2020 - link
Sure, the box sitting right next to my desk doesn't exist. Nor the 10 or so AMD cards I've bought over the past 20 years.1 5970
2 7970s (for CFX)
1 Sapphire 290x (BF4 edition, ridiculously loud under load)
2 XFX 290 (much better cooler than the BF4 290x) mistakenly bought when I thought it would accept a flash to 290x, got the wrong builds, for CFX)
2 290x 8gb sapphire custom edition (for CFX, much, much quieter than the 290x)
1 Vega 64 watercooled (actually turned out to be useful for a Hackintosh build)
1 5700xt stock edition
Yeah, i just made this stuff up off the top of my head. I guarantee I've had more experience with AMD videocards than the average gamer. Remember the separate CFX CAP profiles? I sure do.
So please, tell me again how I'm only a Nvidia owner.
Santoval - Sunday, September 20, 2020 - link
If the top-end Big Navi is going to be 30-40% faster than the 2080 Ti then the 3080 (and later on the 3080 Ti, which will fit between the 3080 and the 3090) will be *way* beyond it in performance, in a continuation of the status quo of the last several graphics card generations. In fact it will be even worse this generation, since Big Navi needs to be 52% faster than the 2080 Ti to even match the 3070 in FP32 performance.Sure, it might have double the memory of the 3070, but how much will that matter if it's going to be 15 - 20% slower than a supposed "lower grade" Nvidia card? In other words "30-40% faster than the 2080 Ti" is not enough to compete with Ampere.
By the way, we have no idea how well Big Navi and the rest of the RDNA2 cards will perform in ray-tracing, but I am not sure how that matters to most people. *If* the top-end Big Navi has 16 GB of RAM, it costs just as much as the 3070 and is slightly (up to 5-10%) slower than it in FP32 performance but handily outperforms it in ray-tracing performance then it might be an attractive buy. But I doubt any margins will be left for AMD if they sell a 16 GB card for $500.
If it is 15-20% slower and costs $100 more noone but those who absolutely want 16 GB of graphics RAM will buy it; and if the top-end card only has 12 GB of RAM there goes the large memory incentive as well..
Spunjji - Sunday, September 20, 2020 - link
@Santoval, why are you speaking as if the 3080's performance characteristics are not already known? We have the benchmarks in now.More importantly, why are you making the assumption that AMD need to beat Nvidia's theoretical FP32 performance when it was always obvious (and now extremely clear) that it has very little bearing on the product's actual performance in games?
The rest of your speculation is knocked out of what by that. The likelihood of an 80CU RDNA 2 card underperforming the 3070 is nil. The likelihood of it underperforming the 3080 (which performs like twice a 5700, non-XT) is also low.
Byte - Monday, September 21, 2020 - link
Nvidia probably has a good idea how it performs with access to PS5/Xbox, they know they had to be aggressive this round with clock speeds and pricing. As we can see 3080 is almost maxed, o/c headroom like that of AMD chips, and price is reasonable decent, in line with 1080 launch prices before minepocalypse.TimSyd - Saturday, September 19, 2020 - link
Ahh don't ya just love the fresh smell of TROLLevernessince - Sunday, September 20, 2020 - link
The 5700XT is RDNA1 and it's 1/3rd the size of the 2080 Ti. 1/3rd the size and only 30% less performance. Now imagine a GPU twice the size of the 5700XT, thus having twice the performance. Now add in the node shrink and new architecture.I wouldn't be surprised if the 6700XT beat the 2080 Ti, let alone AMD's bigger Navi 2 GPUs.
Cooe - Friday, December 25, 2020 - link
Hahahaha. "Only matching a 2080 Ti". How's it feel to be an idiot?tipoo - Friday, September 18, 2020 - link
I'd again ask you why a laptop SoC would have an answer for a big GPU. That's not what this product is.dotjaz - Friday, September 18, 2020 - link
"This Intel Tiger" doesn't need an answer for Big Navi, no laptop chip needs one at all. Big Navi is 300W+, no way it's going in a laptop.RDNA2+ will trickle down to mobile APU eventually, but we don't know if Van Gogh can beat TGL yet, I'm betting not because it's likely a 7-15W part with weaker Quadcore Zen2.
Proper RDNA2+ APU won't be out until 2022/Zen4. By then Intel will have the next gen Xe.
Santoval - Sunday, September 20, 2020 - link
Intel's next gen Xe (in Alder Lake) is going to be a minor upgrade to the original Xe. Not a redesign, just an optimization to target higher clocks. The optimization will largely (or only) happen at the node level, since it will be fabbed with second gen SuperFin (formerly 10nm+++), which is supposed to be (assuming no further 7nm delays) Intel's last 10nm node variant.How well will that work, and thus how well 2nd gen Xe will perform, will depend on how high Intel's 2nd gen SuperFin will clock. At best 150 - 200 MHz higher clocks can probably be expected.