The Intel Comet Lake Core i9-10900K, i7-10700K, i5-10600K CPU Review: Skylake We Go Again
by Dr. Ian Cutress on May 20, 2020 9:00 AM EST- Posted in
- CPUs
- Intel
- Skylake
- 14nm
- Z490
- 10th Gen Core
- Comet Lake
CPU Performance: Synthetic Tests
As with most benchmark suites, there are tests that don’t necessarily fit into most categories because their role is just to find the peak throughput in very particular coding scenarios. For this we rely on some of the industry standard tests, like Geekbench and Cinebench.
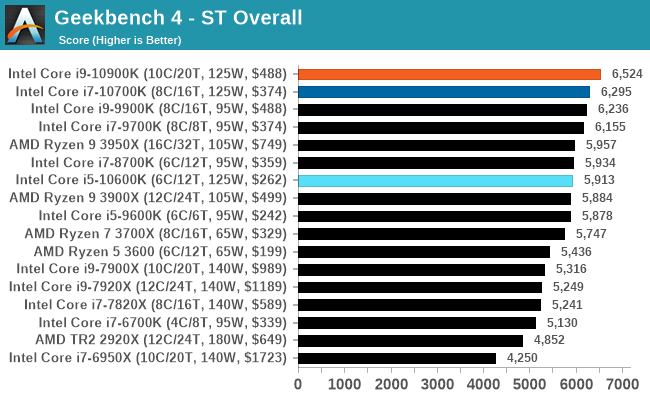
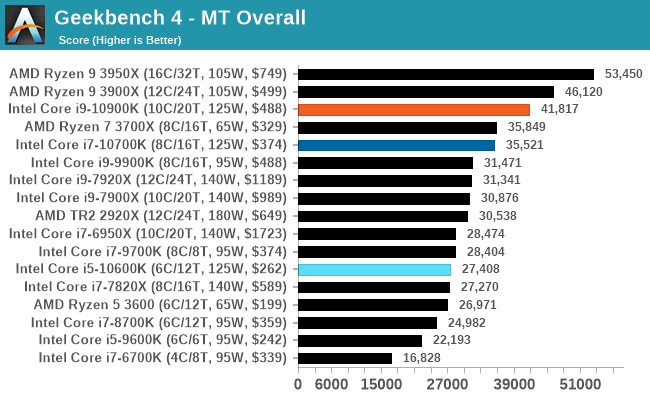
GeekBench4: Synthetics
A common tool for cross-platform testing between mobile, PC, and Mac, GeekBench 4 is an ultimate exercise in synthetic testing across a range of algorithms looking for peak throughput. Tests include encryption, compression, fast Fourier transform, memory operations, n-body physics, matrix operations, histogram manipulation, and HTML parsing.
I’m including this test due to popular demand, although the results do come across as overly synthetic, and a lot of users often put a lot of weight behind the test due to the fact that it is compiled across different platforms (although with different compilers).
We record the main subtest scores (Crypto, Integer, Floating Point, Memory) in our benchmark database, but for the review we post the overall single and multi-threaded results.
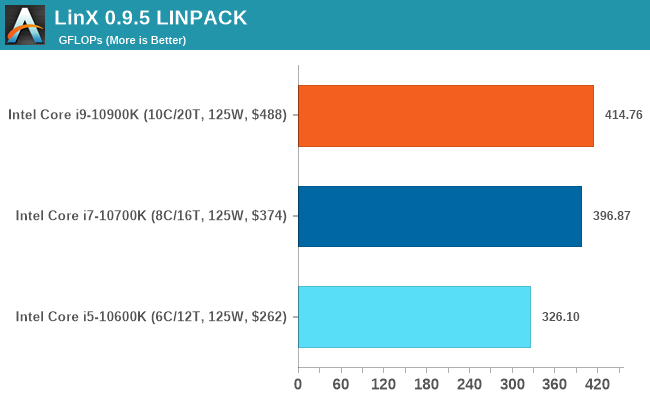
LinX: LINPACK
The main tool for ordering the TOP500 computer list involves running a variant of an accelerated matrix multiply algorithm typically found from the LINPACK suite. Here we use a tool called LinX to do the same thing on our CPUs. We scale our test based on the number of cores present in order to not run out of scaling but still keeping the test time consistent.
This is another of our new tests for 2020. Data will be added as we start regression testing older CPUs.
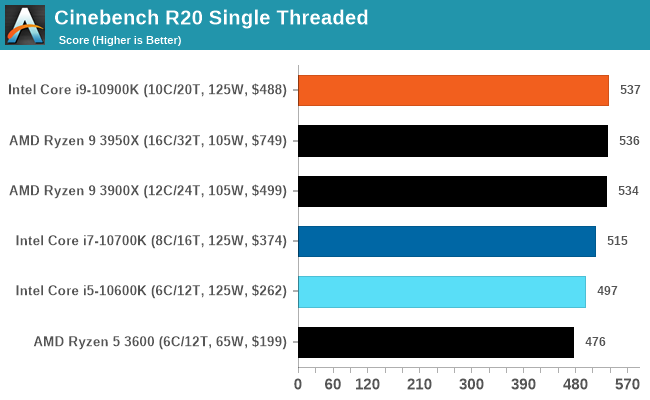
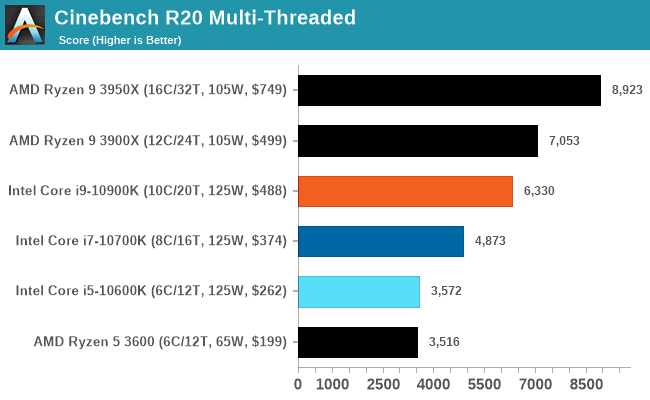
Cinebench R20
The Cinebench line of tests is very well known among technology enthusiasts, with the software implementing a variant of the popular Cinema4D engine to render through the CPU a complex scene. The latest version of Cinebench comes with a number of upgrades, including support for >64 threads, as well as offering a much longer test in order to stop the big server systems completing it in seconds. Not soon after R20 was launched, we ended up with 256 thread servers that completed the test in about two seconds. While we wait for the next version of Cinebench, we run the test on our systems in single thread and multithread modes, running for a minimum of 10 minutes each.


220 Comments
View All Comments
catavalon21 - Wednesday, May 20, 2020 - link
+1Lord of the Bored - Friday, May 22, 2020 - link
The nostalgia is strong these days.Bidz - Wednesday, May 20, 2020 - link
So... where is the temperature chart? Given the power usage and the tier level of the product I would say many users want to know how practical it is to use.LawRecords - Wednesday, May 20, 2020 - link
Agreed. Its odd that thermals are missing given the high power draw.shabby - Wednesday, May 20, 2020 - link
I'd imagine it would be pegged at 90c since the cpu is constantly clocking itself as high as it can.DannyH246 - Wednesday, May 20, 2020 - link
Its not odd at at all. Its to make Intel look better we all know this.shady28 - Wednesday, May 20, 2020 - link
LTT has a video on thermals. The thermals for the gen 10 are better than gen 9, despite the higher clocks and core counts. Intel redesigned the conductive layer between the die and the lid. It worked.Spunjji - Tuesday, May 26, 2020 - link
Seriously? The thermals are better despite the higher power draw?I'm guessing this is a case of being able to get the heat out more easily *if you have a cooling system capable of subsequently dealing with the heat being pulled out*. That would make sense given the changes involved, but it involves the assumption that people are prepared to go from 280mm+ radiators.
mrvco - Wednesday, May 20, 2020 - link
I get that this is a CPU review and not a GPU or system review, but it would be helpful to also include gaming resolutions w/ quality settings that people actually use for gaming rather just benchmarking... especially when building a gaming system and making decisions on how to allocate budget between CPU (+p/s +cooling) and GPU.TheUnhandledException - Wednesday, May 20, 2020 - link
I agree. Yes the result will show nearly identical performance from a 10900 down to an Ryzen 3600 but that is kinda the point. You don't really need an ultra high end CPU for gaming at high resolution. Even if it was just one game it would be nice to see how CPU performance scales at 1080p, 1080p high quality, 1440p, and 4K.