Amazon's Arm-based Graviton2 Against AMD and Intel: Comparing Cloud Compute
by Andrei Frumusanu on March 10, 2020 8:30 AM EST- Posted in
- Servers
- CPUs
- Cloud Computing
- Amazon
- AWS
- Neoverse N1
- Graviton2
SPEC - Multi-Core Performance Scaling
I did mention the L3 cache of the Graviton2 was shared amongst all its cores, and we also discovered how only 8-16 cores were able to saturate the memory controllers of the system. To put those aspects into better context, I ran the SPEC suites at rate instance numbers, ranging from 16, 32, 48 and the full 64 cores, and normalised the results relative to the per-thread performance showcased in the rate-1 single-threaded runs.
What this attempts to showcase is the performance scaling of the full SoC across varying loads of the different workload types. Scaling linearly across cores might be easy for some workloads, but for anything that even remotely has some kind of memory pressure should see greater slowdowns given that all the threads are competing for the shared L3 and DRAM resources.
The testing here for all figures were done on a 16xlarge instance with 64 vCPUs to avoid the possibility of noisy neighbours, and give better reliability in the lower core count results.
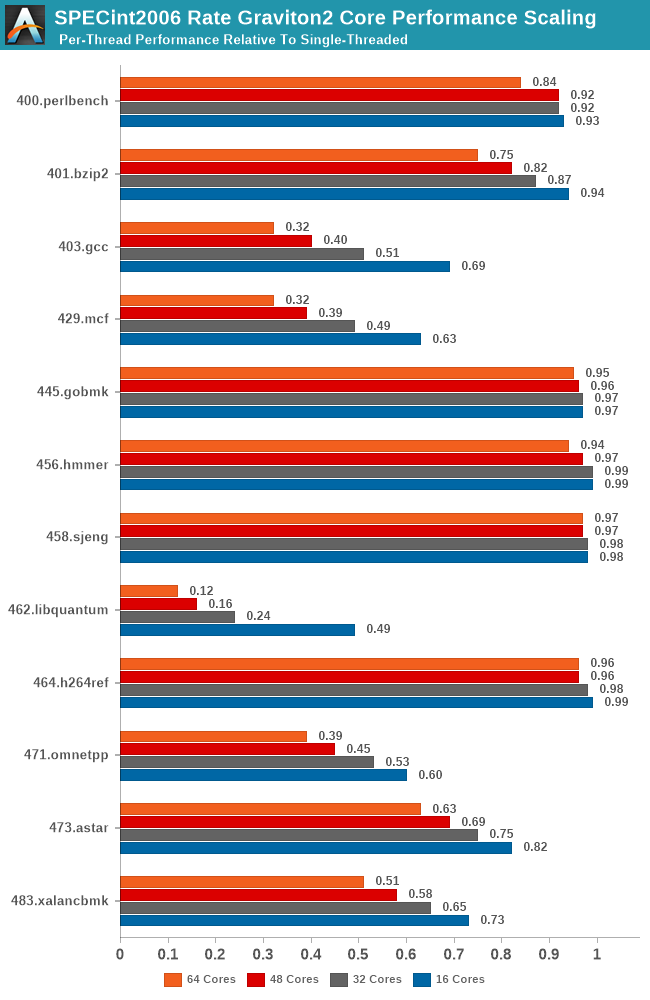
As expected, we’re seeing a quite wide range of results here, and it’s also a good showcase of which SPEC workloads are memory and cache intensive and which are not. Workloads such as 445.gobmk and 456.hmmer aren’t surprising in their near linear scaling as they don’t have too much cache pressure, and the Graviton2’s 1MB L2 per core is also more than enough for 464.h264ref.
On the other hand, well known memory intensive workloads such as 462.libquantum absolutely crater in terms of per-thread performance. This memory bandwidth demanding workload is fully saturating the bandwidth of the system early on with very few cores, meaning that performance barely increases the more threads and cores we throw at it. Such a scaling more or less is mimicked in other workloads of varying cache and memory pressure.
The most worrying result though is 403.gcc. Code compilation should have been one of the bigger use-cases for a platform such as Graviton2, but the platform is having issues scaling well with core count, undoubtedly a result of higher cache pressure of the system. In a single-thread scenario in the system a core would have access to 33MB L2+L3, but when having 64 cores doing the same thing at once you’d end up with only 1.5MB per core, assuming things are evenly competitively shared.
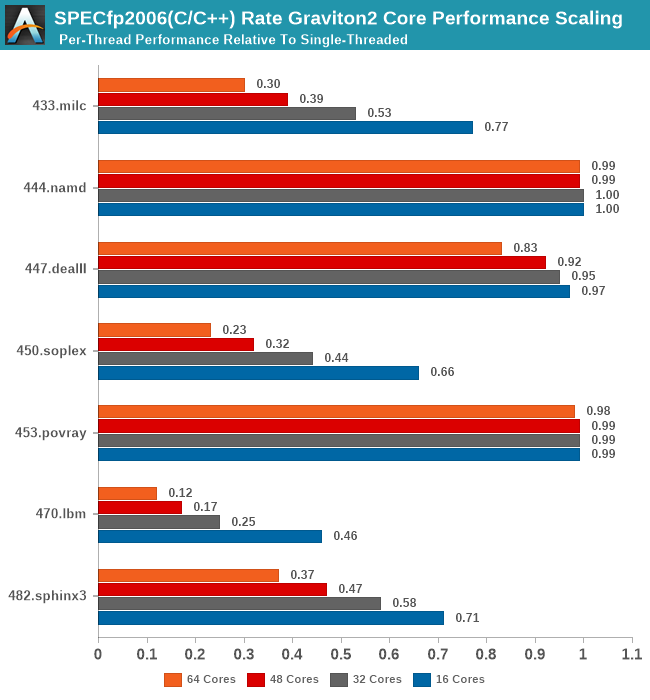
In SPECfp2006, again, we see the well-known memory intensive workloads such as 433.milc and 470.lbm crater in their per-thread performance the more threads you throw at the system, while other workloads are able to scale near linearly with cores.
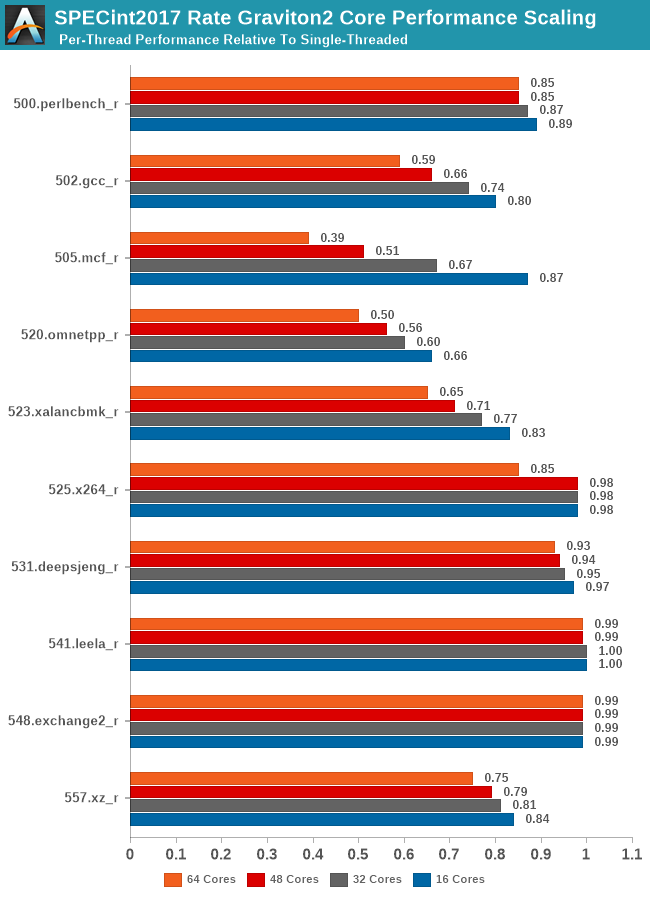
In SPECint2017, we see the workload changes I referred to previously on the single-threaded page. The new gcc and mcf tests are actually scaling better than their 2006 counterparts due to actually reduced memory pressure on the new tests. It does beg the question of which variant of the test is actually more representative of most workloads of these types.
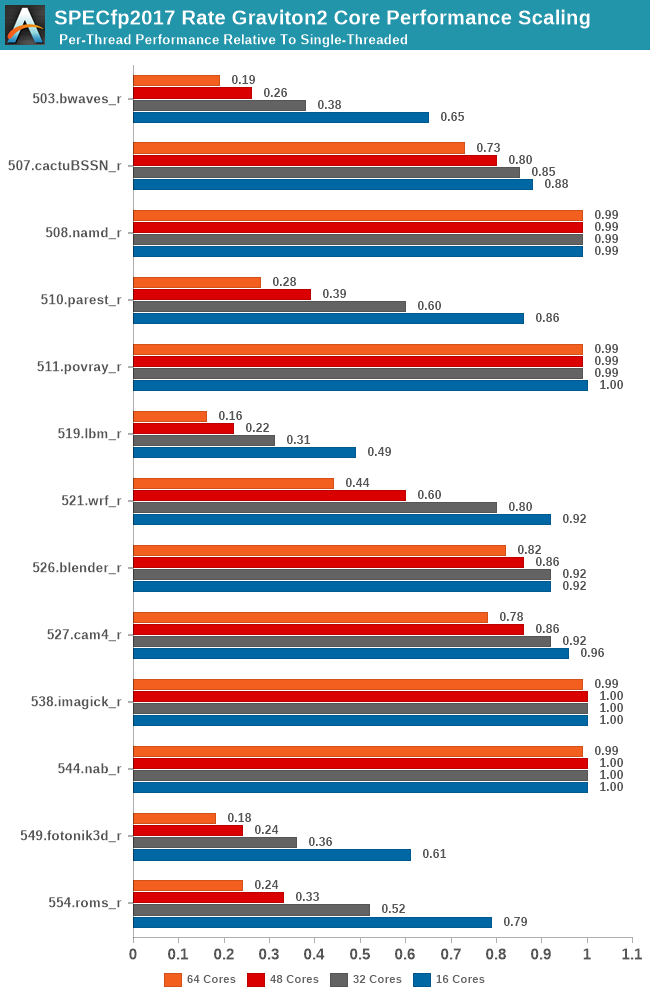
Compared to the int2017 suite, the fp2017 suite scales significantly worse for a larger number of workloads. When Ampere last week talked about its Altra processor, and that it was “designed for integer workloads”, that didn't make too much sense other than in the context that the N1 cores are missing wider SIMD execution units. What does make sense though is that the floating-point suite of SPEC is a lot more memory intensive and SoCs like the Graviton2 don’t fare as well at higher loaded core-counts.
It will be interesting to see where the Arm chip designers are heading to in regards to this general memory bottleneck. If your workload isn’t too memory intensive then scaling up to such huge core counts is an easy way to scale performance as well. On the opposite end of the spectrum on memory hungry workloads, these chips will just be memory starved. Arm had envisioned 64 core Neoverse N1 systems to have 64-128MB of L3 cache, and the CMN-600 scales up to 256MB total in a 128-core system, which seem like more sensible and balanced targets.


96 Comments
View All Comments
imaskar - Friday, June 12, 2020 - link
There's a major flaw in the price comparison - why did they take m5n (which has additional network quota) instead of regular m5? It would be $3.07 instead $3.808BlueLikeYou - Tuesday, September 1, 2020 - link
Maybe I'm missing something, but the SPEC numbers seem a little low compared to published results. For example, an Intel Xeon Platinum 8260 scores around 280ish for 48 cores on SPEC INT RATE 2017. This chip is pretty similar to an 8259CL, except that the 8259CL has a slightly higher frequency at 2.5 GHz vs 2.4 GHz for the 8260.The m5n.16xlarge has 32 cores. (32/48) * 280 = 187.67. Your result was 157.36; about 83% of my guess. Granted, performance will probably not scale exactly linearly and there may be a little virtualization overhead, but that drop still seems a little steep.
sgovindan - Friday, June 25, 2021 - link
Hi Andrei,I'm trying to replicate your PMBW bandwidth numbers on the AWS with a C6G instance, but I seem to be getting lower BW estimates - ~170 GB/s for the scalar reads (64-bit) and ~160 GB/s for scalar writes for 64 threads. I've tried both 64GB and 1 GB as the test sizes (the -s and -S parameters of PMBW). Could you confirm the test sizes and/or command-lines used for your results? Thanks.