Enterprise NVMe Round-Up 2: SK Hynix, Samsung, DapuStor and DERA
by Billy Tallis on February 14, 2020 11:15 AM ESTPeak Throughput
For client/consumer SSDs we primarily focus on low queue depth performance for its relevance to interactive workloads. Server workloads are often intense enough to keep a pile of drives busy, so the maximum attainable throughput of enterprise SSDs is actually important. But it usually isn't a good idea to focus solely on throughput while ignoring latency, because somewhere down the line there's always an end user waiting for the server to respond.
In order to characterize the maximum throughput an SSD can reach, we need to test at a range of queue depths. Different drives will reach their full speed at different queue depths, and increasing the queue depth beyond that saturation point may be slightly detrimental to throughput, and will drastically and unnecessarily increase latency. Because of that, we are not going to compare drives at a single fixed queue depth. Instead, each drive was tested at a range of queue depths up to the excessively high QD 512. For each drive, the queue depth with the highest performance was identified. Rather than report that value, we're reporting the throughput, latency, and power efficiency for the lowest queue depth that provides at least 95% of the highest obtainable performance. This often yields much more reasonable latency numbers, and is representative of how a reasonable operating system's IO scheduler should behave. (Our tests have to be run with any such scheduler disabled, or we would not get the queue depths we ask for.)
Unlike last year's enterprise SSD reviews, we're now using the new io asynchronous IO APIs on Linux instead of the simpler synchronous APIs that limit software to one outstanding IO per thread. This means we can hit high queue depths without loading down the system with more threads than we have physical CPU cores, and that leads to much better latency metrics—but the impact on SATA drives is minimal because they are limited to QD32. Our new test suite uses up to 16 threads to issue IO.
Peak Random Read Performance
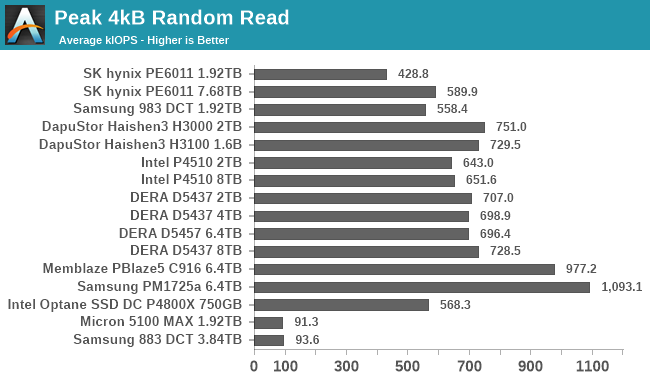
Our new test suite with the CPU bottleneck removed is very helpful to the peak random read performance scores of most of these drives. The two SSDs with a PCIe x8 interface stand out. Both can hit over 1M IOPS with a sufficiently high queue depth, though the scores shown here are for somewhat lower queue depths where latency is more reasonable. We're still looking at very high queue depths to get within a few percent of 1M IOPS: QD192 for the Samsung PM1725a and QD384 for the Memblaze PBlaze5 C916.
The U.2 drives are all limited to PCIe 3.0 x4 speeds, and the best random read performance we see out of them comes from the DapuStor Haishen3 H3000 at 751k IOPS, but that's closely followed by the other Dapu drive and all four of the DERA SSDs. The SK hynix PE6011 is the slowest NVMe model here, with its 8TB version coming up just short of 600k IOPS. The Intel Optane SSD's standing is actually harmed significantly by this year's test suite upgrade, because even under last year's suite the drive was as much of a bottleneck as the CPU. Reducing the CPU overhead has allowed many of the flash-based SSDs to pull ahead of the Optane SSD for random read throughput.
 |
|||||||||
| Power Efficiency in kIOPS/W | Average Power in W | ||||||||
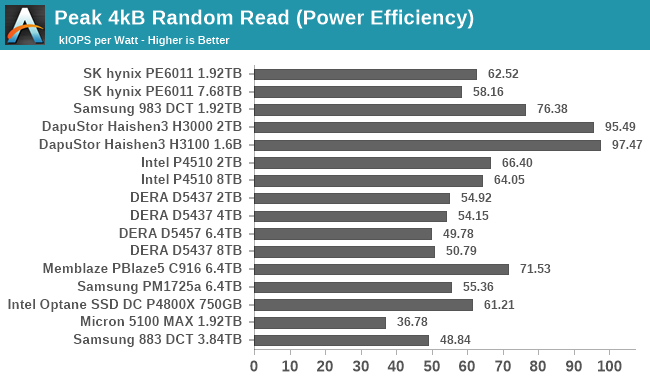
Now that we're letting the drives run at high queue depths, the big 16-channel controllers aren't automatically at a disadvantage for power efficiency. Those drives are still drawing much more power (13-14W for the DERA and Memblaze, almost 20W for the Samsung PM1725a), but they can deliver a lot of performance as a result. The drives with 8-channel controllers are mostly operating around 7W, though the 7.68TB SK Hynix PE6011 pushes that up to 10W.
Putting that all in terms of performance per Watt, the DapuStor Haishen3 drives score another clear win on efficiency. Second and third palce are taken by the Samsung 983 DCT and Memblaze PBlaze5 C916, two drives at the opposite end of the power consumption spectrum. After that the scores are fairly tightly clustered with smaller capacity models generally delivering better performance per Watt, because even the 2TB class drives get pretty close to saturating the PCIe 3.0 x4 link and they don't need as much power as their 8TB siblings.
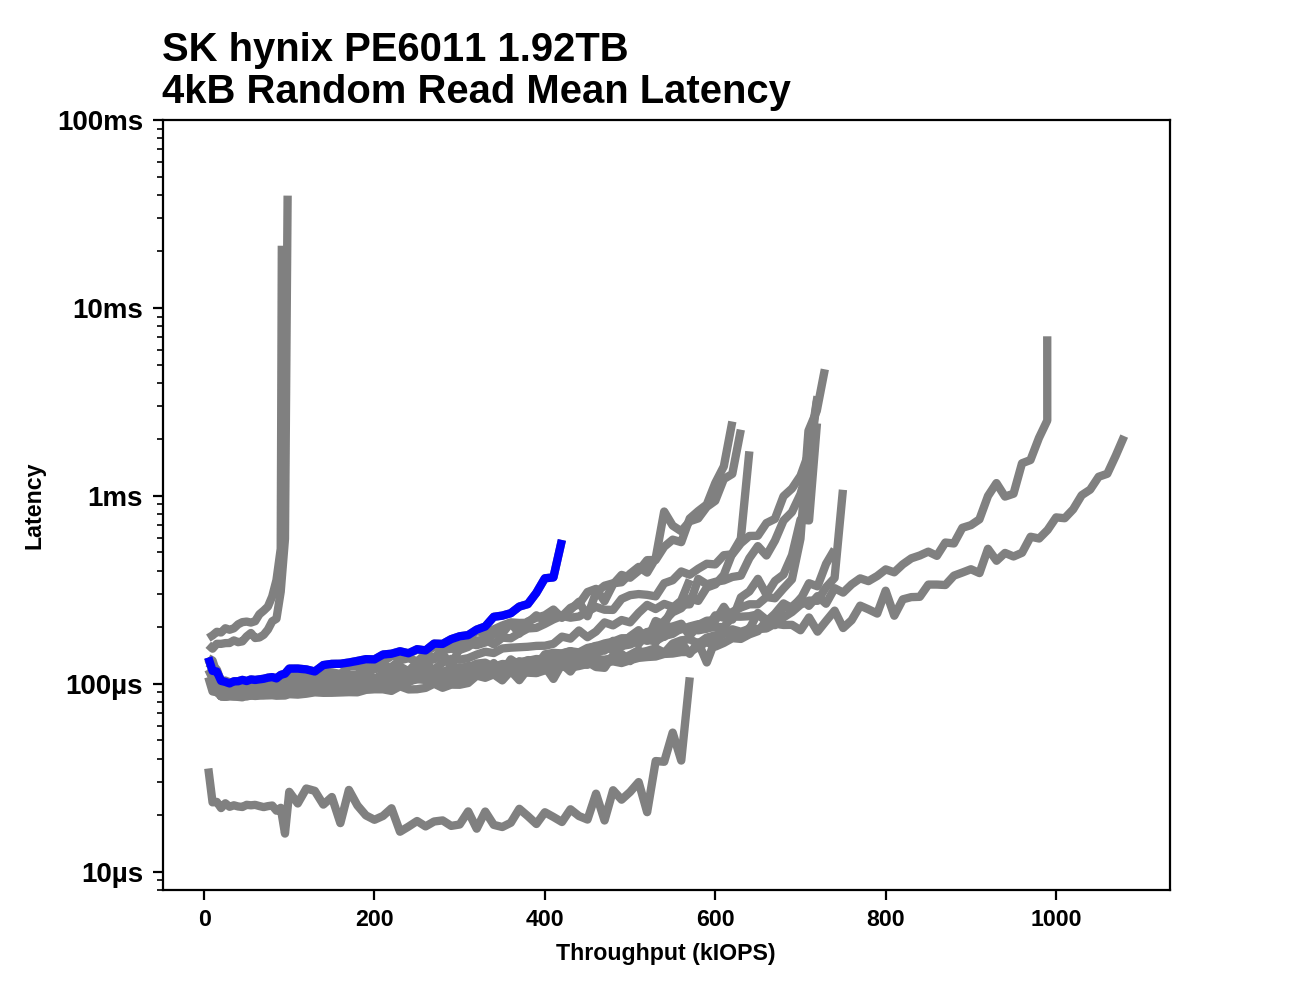
For latency scores, we're no longer going to look at just the mean and tail latencies at whatever queue depth gives peak throughput. Instead, we've run a separate test that submits IO requests at fixed rates, rather than at fixed queue depths. This is a more realistic way of looking at latency under load, because in the real world user requests don't stop arriving just because your backlog hits 32 or 256 IOs. This test starts at a mere 5k IOPS and steps up at 5k increments up to 100k IOPS, and then at 10k increments the rest of the way up to the throughput limit of these drives. That's a lot of data points per drive, so each IO rate is only tested for 64GB of random reads and that leads to the tail latency scores being a bit noisy.
 |
|||||||||
| Mean | Median | 99th Percentile | 99.9th Percentile | 99.99th Percentile | |||||
For most drives, the mean and median latency curves show pretty much what we expect: moderate latency increases through most of the performance range, and a steep spike as the drive approaches saturation. When looking at 99th and higher percentiles, things get more interesting. Quite a few drives end up with high tail latency long before reaching their throughput limit, especially the ones with the highest capacities. This leads to the DapuStor Haishen3 SSDs (1.6 and 2 TB) having the best QoS scores from roughly 550k (where the Optane SSD drops out) to their limit around 750k IOPS. The Memblaze PBlaze5 and Samsung PM1725a may both be able to get up to 1M IOPS, but by about 600k IOPS their 99th percentile read latency is already closing in on 10ms. The Intel, Hynix and DERA 8TB class drives also show 99th percentile latency spiking by the time the reach 400k IOPS even though all three can handle throughput up to at least ~600k IOPS.
When going beyond 99th percentile, most of the differences between drives get lost in the noise, but a few are still clearly identifiable losers: the SK hynix PE6011 7.68TB and Intel P4510 8TB, with 10-20ms tail latencies that show up even at relatively low throughput.
Peak Sequential Read Performance
Rather than simply increase the queue depth of a single benchmark thread, our sequential read and write tests first scale up the number of threads performing IO, up to 16 threads each working on different areas of the drive. This more accurately simulates serving up different files to multiple users, but it reduces the effectiveness of any prefetching the drive is doing.
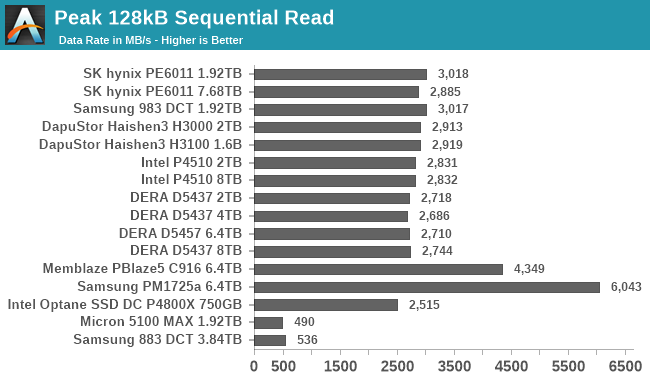
The two PCIe x8 drives stand out on the sequential read test; the Samsung PM1725a at 6GB/s is quite a bit faster than the Memblaze's 4.3GB/s. The U.2 drives all perform fairly similarly, at or just below 3GB/s. Many of them are rated to perform more around 3.2-3.5GB/s, but our test includes multiple threads reading sequentially at moderate queue depths rather than one thread at high queue depths, so the SSDs don't have as much spatial locality to benefit from.
 |
|||||||||
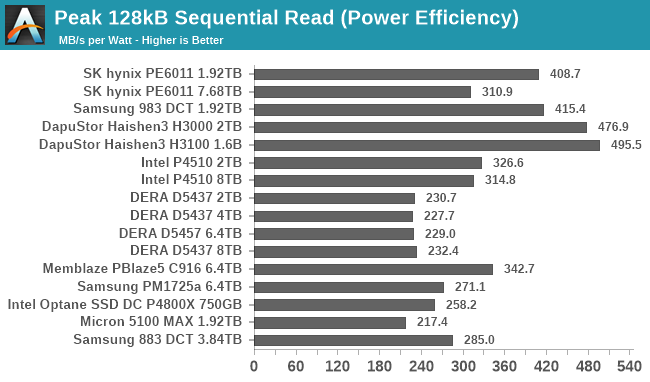
| Power Efficiency in MB/s/W | Average Power in W | ||||||||
With a fairly level playing field in terms of sequential read performance, it's no surprise to see big disparities show up again in the power efficiency scores. The DERA SSDs at just under 12W have the worst efficiency among the NVMe drives. The Samsung PM1725a isn't much better, because even though it delivers 6GB/s, it needs over 22W to do so. The DapuStor Haishen3 SSDs are once again the most efficient, with slightly above-average performance and the lowest total power draw among the NVMe SSDs.
Steady-State Random Write Performance
Enterprise SSD write performance is conventionally reported as steady-state performance rather than peak performance. Sustained writing to a flash-based SSD usually causes performance to drop as the drive's spare area fills up and the SSD needs to spend some time on background work to clean up stale data and free up space for new writes. Conventional wisdom holds that writing several times the drive's capacity should be enough to get a drive to steady-state, because nobody actually ships SSDs with greater than 100% overprovisioning ratios. In practice things are sometimes a bit more complicated, especially for SATA drives where the host interface can be such a severe bottleneck. Real-world write performance ultimately depends not just on the current workload, but also on the recent history of how a drive has been used, and no single performance test can capture all the relevant effects.
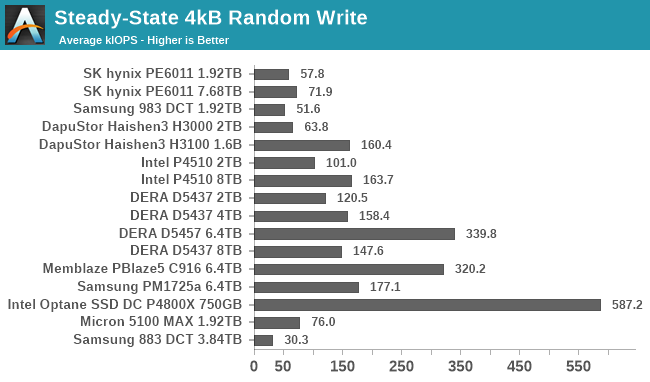
Steady-state random write throughput is determined mostly by how much spare area a drive has: the product of its capacity and overprovisioning ratio. That's how the 1.6TB DeraStor Haishen3 H3100 (2TB raw) is able to beat the 8TB and 7.68TB models that have very slim OP ratios. It's also how the Micron 5100 MAX SATA drive is able to beat several NVMe drives. The 6.4TB drives combine high OP and high raw capacity and take the top three spots among the flash-based SSDs. The Samsung PM1725a is the slowest of those three despite carrying the highest write endurance rating, likely because the older Samsung 48L flash it used has worse program or erase times than the IMFT 64L flash used by the DERA and Memblaze drives. And of course, the Optane SSD performs far beyond what any of these drives can sustain, because it doesn't have to shuffle around data behind the scenes while performing really slow block erase operations.
 |
|||||||||
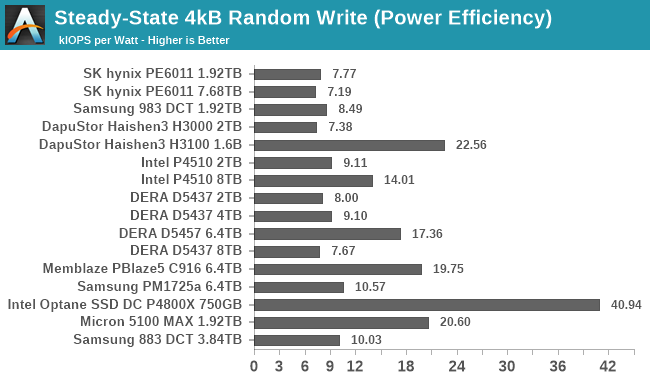
| Power Efficiency in kIOPS/W | Average Power in W | ||||||||
The steady-state random write test pushes each drive to its power limits. That brings the most power-hungry high-capacity 16-channel drives up to almost 20W, which is about as much as the U.2 form factor can reasonably handle. The Optane SSD and the handful of drives with high OP turn in the best efficiency scores. Among the drives with low OP and write endurance ratings around 1 DWPD, the Intel P4510 seems to score best, and the 16-channel DERA D5437 is slightly more efficient than the 8-channel SK hynix PE6011.
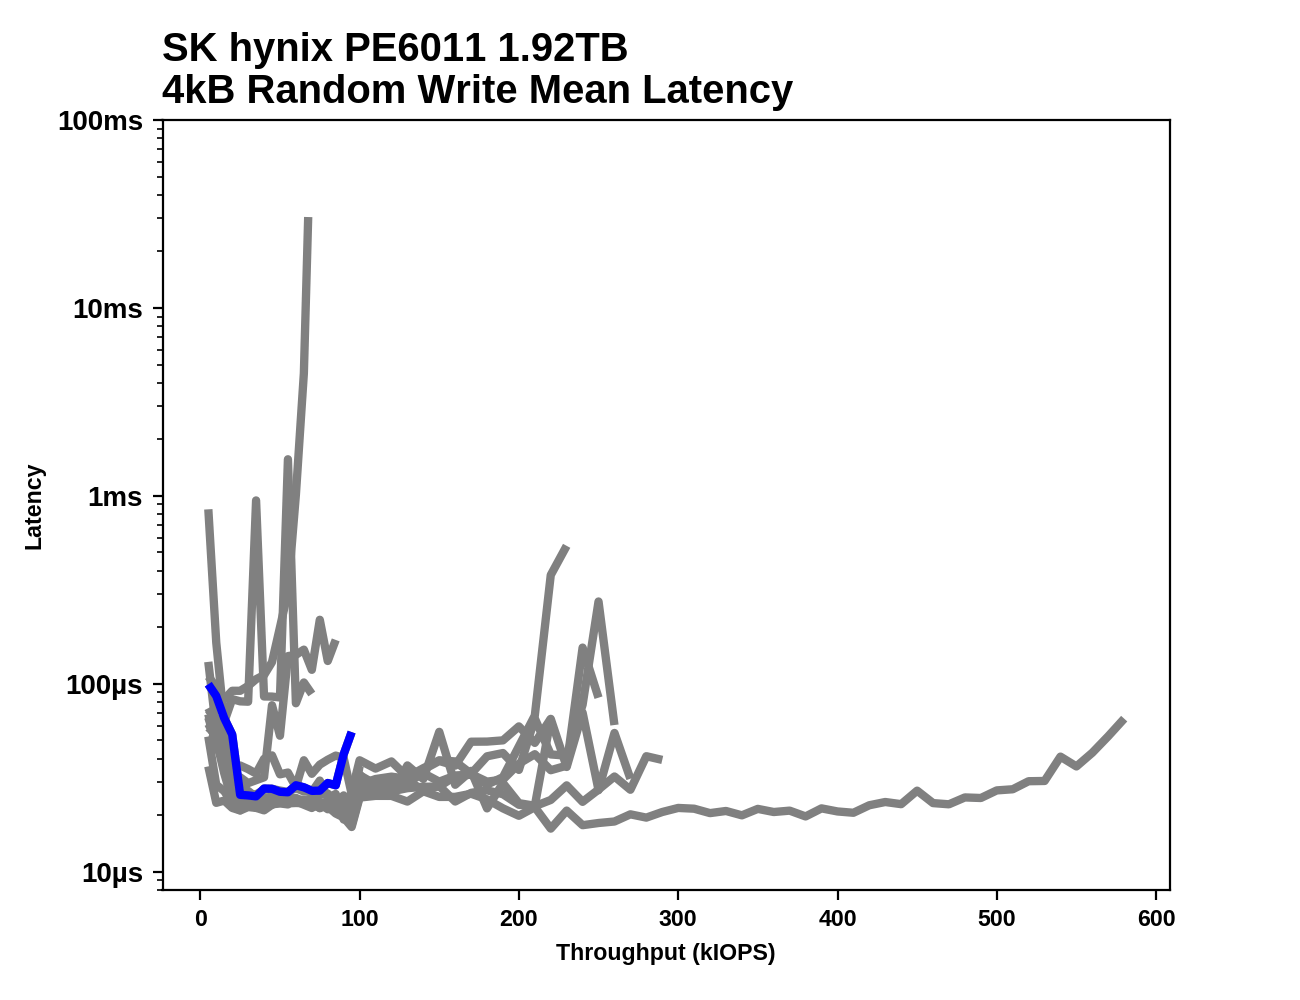
To analyze random write latency vs throughput, we run the same kind of test as for random reads: writing at a series of fixed rates rather than at fixed queue depths. These results show two probable artifacts of our test procedure that we haven't fully investigated. First, latency at the slowest IO rates is excessively high, which may be a result of how fio's completion latency measurement interacts with its rate-limiting mechanism. There's also a dip in latency right before 100k IOPS, which is where this test switches from using 8 threads to 16 threads. Threads that are relatively busy and don't spend much time sleeping seem to have noticeably better response times. It might be possible to eliminate both of these effects by playing around with scheduler and power management settings, but for this review we wanted to stick to the defaults as much as reasonably possible.
 |
|||||||||
| Mean | Median | 99th Percentile | 99.9th Percentile | 99.99th Percentile | |||||
For most of their performance range, these drives stick close to the 20-30µs mean latency we measured at QD1 (which corresponds to around 30k IOPS). The Memblaze PBlaze5 C916 is the only flash-based SSD that maintains great QoS past 100k IOPS. The other drives that make it that far (the Samsung PM1725 and the larger DERA SSDs) start to show 99th percentile latencies over 100µs. The DapuStor Haishen3 H3100 1.6TB showed great throughput when testing at fixed queue depths, but during this test of fixed IO rates it failed out early from an excessive IO backlog, and the H3000 has the worst 99th percentile write scores out of all of the NVMe drives.
Steady-State Sequential Write Performance
As with our sequential read test, we test sequential writes with multiple threads each performing sequential writes to different areas of the drive. This is more challenging for the drive to handle, but better represents server workloads with multiple active processes and users.
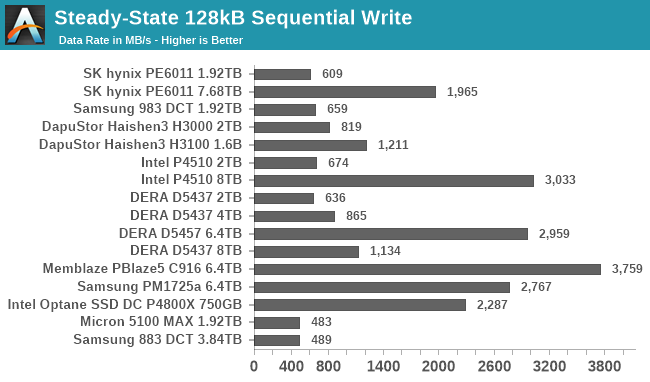
As with random writes, the biggest drives with the most overprovisioning tend to also do best on the sequential write test. However, the Intel and Hynix 8TB drives with more modest OP ratios also perform quite well, a feat that the 8TB DERA D5437 fails to match. The DapuStor Haishen3 drives perform a bit better than other small drives: the 2TB H3000 is faster than its competitors from Samsung, Hynix and DERA, and extra OP helps the 1.6TB H3100 perform almost 50% better. However, even the H3100's performance is well below spec; most of these drives are pretty severely affected by this test's multithreaded nature.
 |
|||||||||
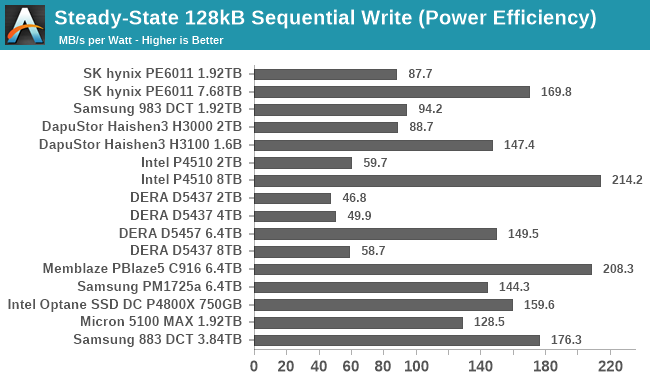
| Power Efficiency in MB/s/W | Average Power in W | ||||||||
For the most part, the fast drives are also the ones with the good power efficiency scores on this test. The 8TB Intel and 6.4TB Memblaze have the two best scores. The SATA drives are also quite competitive on efficiency since they use half the power of even the low-power NVMe drives in this bunch. The low-power 2TB class drives from Hynix, Samsung and DapuStor all have similar efficiency scores, and the DERA D5437 drives that are slow in spite of their 16-channel controller turn in the worst efficiency scores.


33 Comments
View All Comments
Billy Tallis - Friday, February 14, 2020 - link
Me, too. It's a pity that we'll probably never see the Micron X100 out in the open, but I'm hopeful about Intel Alder Stream.I do find it interesting how Optane doesn't even come close to offering the highest throughput (sequential reads or writes or random reads), but its performance varies so little with workload that it excels in all the corner cases where flash fails.
curufinwewins - Friday, February 14, 2020 - link
Absolutely. It's so completely counter to the reliance on massive parallelization and over provisioning/cache to hide the inherent weaknesses of flash that I just can't help but being excited about what is actually possible with it.extide - Friday, February 14, 2020 - link
And honestly most of those corner cases are far more important/common in real world workloads. Mixed read/write, and low QD random reads are hugely important and in those two metrics it annihilates the rest of the drives.PandaBear - Friday, February 14, 2020 - link
Throughput has alot to do with how many dies you can run in parallel, and since optane has a much lower density (therefore more expensive and lower capacity), they don't have as many dies on the same drive, and that's why peak throughput will not be similar to the monsters out there with 128-256 dies on the same drive. They make it back in other spec of course, and therefore demand a premium for that.swarm3d - Monday, February 17, 2020 - link
Sequential read/write speed is highly overrated. Random reads and writes make up the majority of a typical workload for most people, though sequential reads will benefit things like game load times and possibly video edit rendering (if processing isn't a bottleneck, which is usually is).Put another way, if sequential read/write speed was important, tape drives would probably be the dominant storage tech by now.
PandaBear - Friday, February 14, 2020 - link
Some info from the industry is that AWS is internally designing their own SSD and the 2nd generation is based off the same Zao architecture and 96 layer Kioxia NAND that DapuStor makes. For this reason it is likely that it will be a baseline benchmark for most ESSD out there (i.e. you have to be better than that or we can make it cheaper). Samsung is always going to be the powerhouse because they can afford to make a massive controller with so much more circuits that would be too expensive for others. SK Hynix's strategy is to make an expensive controller so they can make money back from the NAND. Dera and DapuStor will likely only focus in China and Africa like their Huawei pal. Micron has a bad reputation as an ESSD vendor and they ended up firing their whole Tidal System team after Sanjay joined, and Sanjay pouched a bunch of WD/SanDisk people to rebuild the whole group from ground up.eek2121 - Friday, February 14, 2020 - link
I wish higher capacity SSDs were available for consumers. Yes, there are only a small minority of us, but I would gladly purchase a high performance 16TB SSD.I suspect the m.2 form factor is imperfect for high density solid state storage, however. Between heat issues (my 2 TB 970 EVO has hit 88C in rare cases...with a heatsink. My other 960 EVO without a heatsink has gotten even hotter.) and the lack of physical space for NAND, we will likely have to come up with another solution if capacities are to go up.
Billy Tallis - Friday, February 14, 2020 - link
Going beyond M.2 for the sake of higher capacity consumer storage would only happen if it becomes significantly cheaper to make SSDs with more than 64 NAND dies, which is currently 4TB for TLC. Per-die capacity is going up slowly over time, but fast enough to keep up with consumer storage needs. In order for the consumer market to shift toward drives with way more than 64 NAND dies, we would need to see per-wafer costs drop dramatically, and that's just not going to happen.Hul8 - Saturday, February 15, 2020 - link
I think the number of consumers both interested in 6GB+ *and* able to afford them are so few, SSD manufacturers figure they can just go buy enterprise stuff.Hul8 - Saturday, February 15, 2020 - link
*6TB+, obviously... :-D