The Microsoft Surface Laptop 3 Showdown: AMD's Ryzen Picasso vs. Intel's Ice Lake
by Brett Howse & Andrei Frumusanu on December 13, 2019 8:30 AM ESTBenchmark Analysis: Boost Behavior
Let’s dig into some of the testing to see how the systems responded during the benchmarks. We re-ran several of the tests while simultaneously monitoring the processor frequency, temperature, and power. Unfortunately for our comparison, the power polling results provided by our monitoring tools don’t seem to monitor the same power draw. The Intel power numbers are for the SoC package, but the AMD power numbers appear to be just the CPU cores, which is an unfortunate byproduct of testing two different platforms.
PCMark 10

PCMark 10 is a benchmark platform that attempts to simulate real-world tasks by running a variety of workflow, and the results were perhaps the most interesting of any of the benchmarks. There is a major discrepancy in how the AMD CPU behaved compared to the Intel. The Ice Lake platform kept the CPU frequency at a minimum of 3.5 GHz, with bursts to 3.9 GHz when under load. The Picasso processor was very aggressively switching from low frequency to high frequency, and was rarely indicating that it was over 3.0 GHz, but clearly demonstrating its higher peak frequency of 4.0 GHz in several locations. Both systems were fairly even in terms of CPU temperature, and Intel’s aggressive turbo levels were evident with peak power levels of 40 Watts for brief moments. The Ice Lake platform finished the benchmark about 200 seconds quicker than the Picasso system.
Cinebench R20 Single-Thread
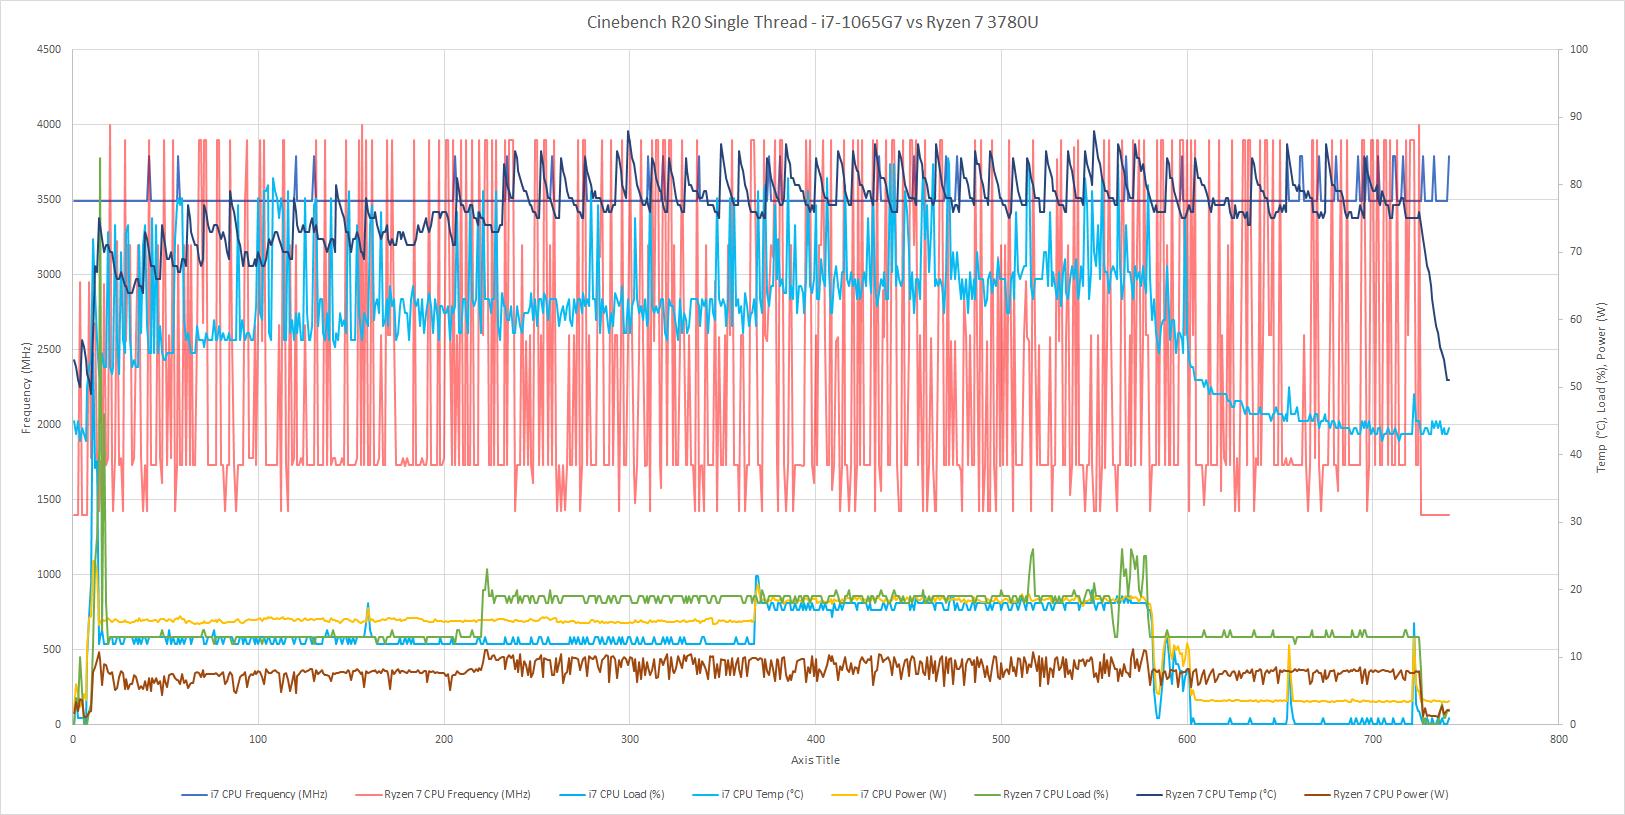
We see somewhat similar results when only a single CPU core is loaded with the Picasso CPU frequency varying quite a bit. There’s also an average higher temperature on the AMD platform during this workload, and once again Ice Lake finishes the rendering quite a bit sooner thanks to its stronger CPU cores.
Cinebench R20 Multi-Thread
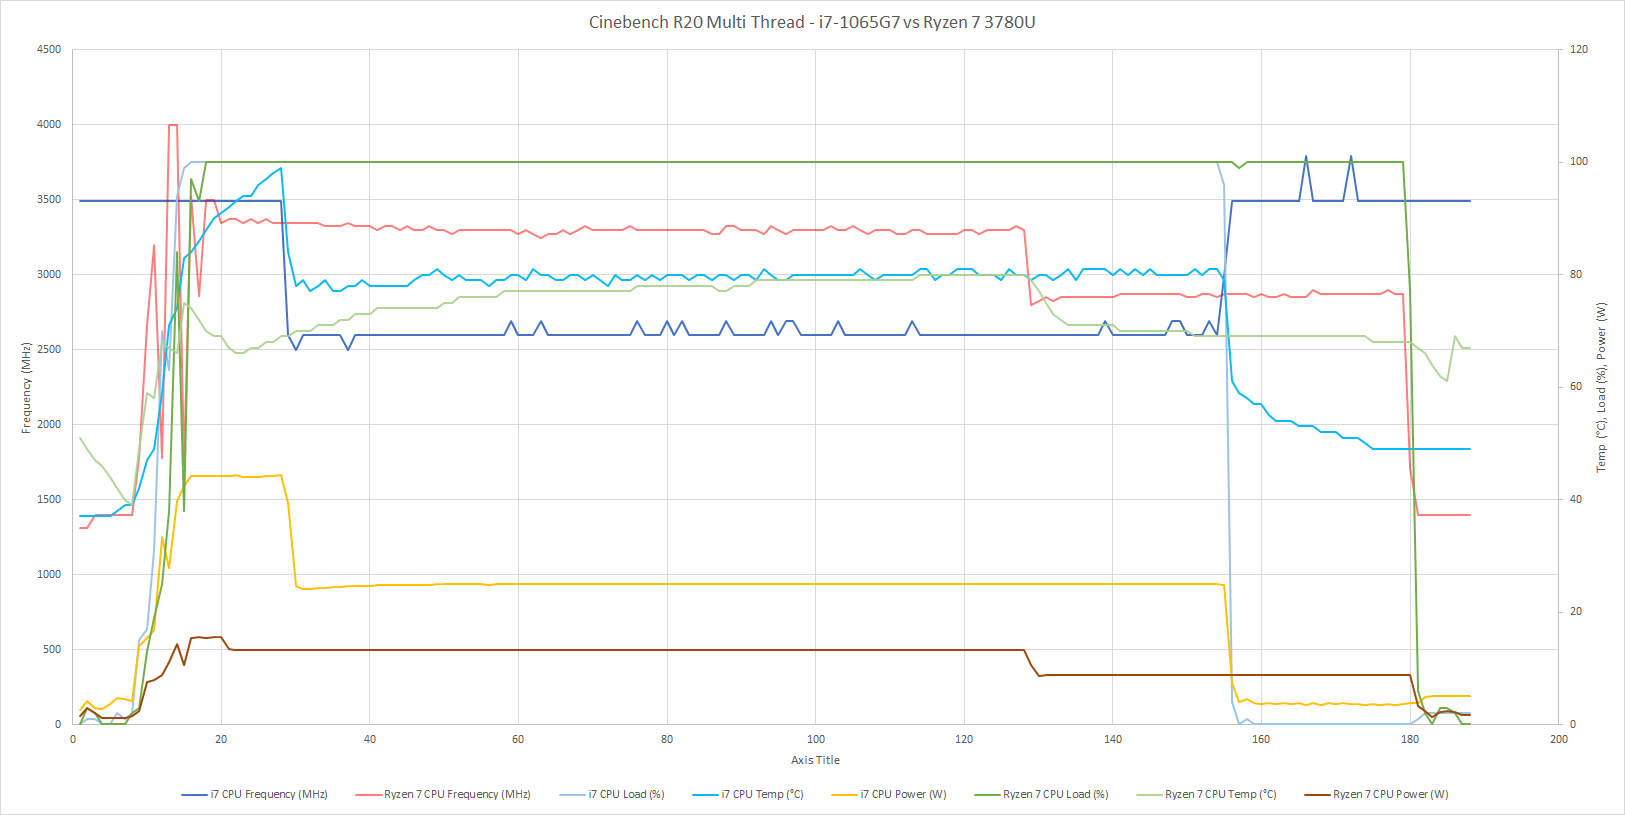
With all cores loaded the graph is considerably altered. Here the AMD processor is able to maintain a much higher frequency across its cores for much longer, while Intel's chip is only able to maintain 3.5 GHz for about 30 seconds before it runs out of headroom, dropping the cores down to around 2.6 GHz. But despite the lower frequency, the much higher IPC on Sunny Cove allows the Ice Lake platform to finish quite a bit sooner.


174 Comments
View All Comments
Fataliity - Friday, December 13, 2019 - link
I didn't notice that graph, your right. It's sad that the thermal throttling is so bad on Ice Lake. Look at how fast it hits 100c and has to lower its frequency to 2.5Ghz. If it could control its temps and didnt use so much power, it would be a beast of a chip.Fataliity - Friday, December 13, 2019 - link
Over 40 Watts at boost frequency! That's insane. more than the TDP of the product.Fataliity - Friday, December 13, 2019 - link
So for servers if scaling is pretty close, its using 5 watts per core at 2.5 GHZ. u can expect 56 Cores in a 280W TDP.At Epyc's TDP of 225W, you can fit 45 cores.
So if Ice Lake is aiming for 280W TDP and, 38? cores. You should be able to hit around 3 GHZ with TDP judging by graph of 30watts being pulled around 3GHZ. (Not counting memory controller etc.) with IPC boost the server part might be decent, albeit with alot less cores.
Fataliity - Friday, December 13, 2019 - link
And Lastly, look at that graph for TDP during boost.https://images.anandtech.com/doci/15213/CinbenchR2...
You will never see Ice Lake desktop product.
Compare the watt graph to Ryzen's wat graph below.
See the way the Ice Lake increases substantially wattage to pull boost clocks? It's probably already near the silicon limit judging by the graph. Like where they plot the voltage vs frequency, showing that the last few hundred mhz takes an insane amount of power. Ice Lake graph shows this in the 3 GHz
sorry no edit button.
Fataliity - Friday, December 13, 2019 - link
25Watts at 2.7-2.9 ghz. 47 watts at 3.7ghz.Brett Howse - Saturday, December 14, 2019 - link
That's how the Power Levels work. Processor gets extended boost level 2 for a certain amount of time. Please see here:https://www.anandtech.com/show/13544/why-intel-pro...
m53 - Sunday, December 15, 2019 - link
@Brett: Why feeding the troll? Just ignore Fataliity. I wish Anandtech has some moderation in the comment section against trolling and spamming.maroon1 - Friday, December 13, 2019 - link
Cpu performance and power effiency is much more important than slightly faster gpu than ryzen has. It is not like people buy these things to play games. And the difference is too small anyway. Ice lake wins in some gamesSo intel is better out of the two
ZoZo - Friday, December 13, 2019 - link
"despite this being a 3.9 GHz chip, in single-threaded SPEC 2017, it managed to come very close to a 5.0 GHz Core i9-9900K with a massively higher TDP"Could you please remind readers how long those benchmarks run? Because if it's less than 10 seconds, the TDP and better heat dissipation of desktops won't provide any benefits on single-threaded workloads and it's misleading to mention it.
In fact, I would really like a comparison of various laptop chips versus desktop chips, in scenarios that require prolonged CPU load, such as compiling the Linux kernel, rendering something, etc. Scenarios where the laptop chips will be undergo throttling and show their weakness or lack thereof compared to desktop chips. Not those 1-second benchmarks such as those that are in AIDA64.
extide - Friday, December 13, 2019 - link
They are pretty long -- they don't mention the runtime of the single thread tests specifically but they do mention the multi thread tests took 4-6 hours. The multi thread tests are the same as the ST ones, just running multiple (8) copies. (This is all talking about the SPEC benchmarks)