The Snapdragon 865 Performance Preview: Setting the Stage for Flagship Android 2020
by Andrei Frumusanu on December 16, 2019 7:30 AM EST- Posted in
- Mobile
- Qualcomm
- Smartphones
- 5G
- Cortex A77
- Snapdragon 865
GPU Performance & Power
On the GPU side of things, testing the QRD865 is a bit complicated as we simply didn’t have enough time to run the device through our usual test methodology where we stress both peak as well as sustained performance of the chip. Thus, the results we’re able to present today solely address the peak performance characteristics of the new Adreno 650 GPU.
Disclaimer On Power: As with the CPU results, the GPU power measurements on the QRD865 are not as high confidence as on a commercial device, and the preliminary power and efficiency figures posted below might differ in final devices.
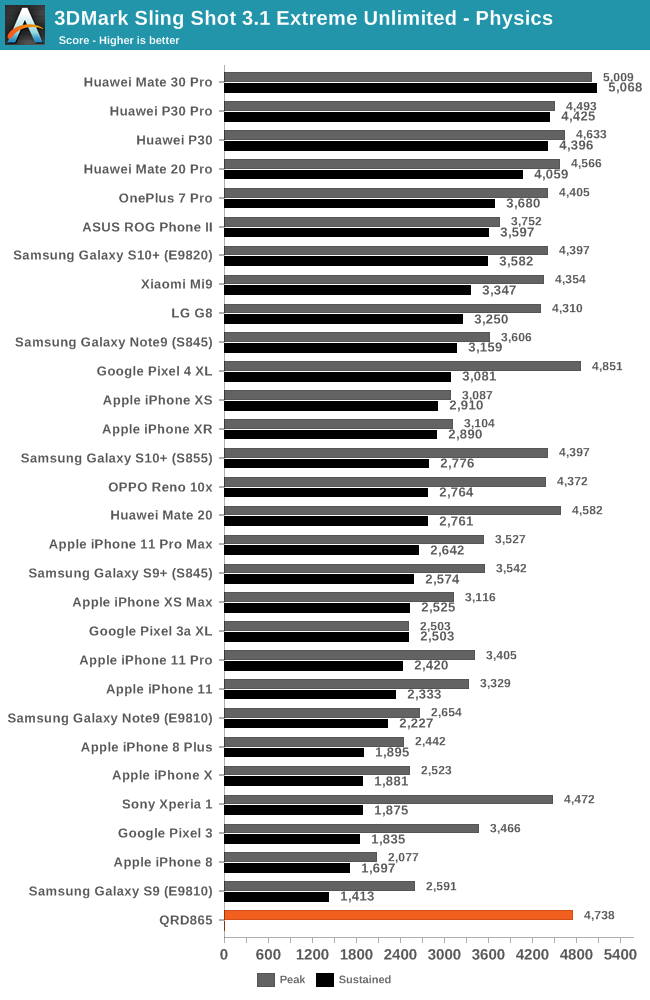
The 3DMark Physics tests is a CPU-bound benchmark within a GPU power constrained scenario. The QRD865 here oddly enough doesn’t showcase major improvements compared to its predecessor, in some cases actually being slightly slower than the Pixel 4 XL and also falling behind the Kirin 990 powered Mate 30 Pro even though the new Snapdragon has a microarchitectural advantage. It seems the A77 does very little in terms of improving the bottlenecks of this test.
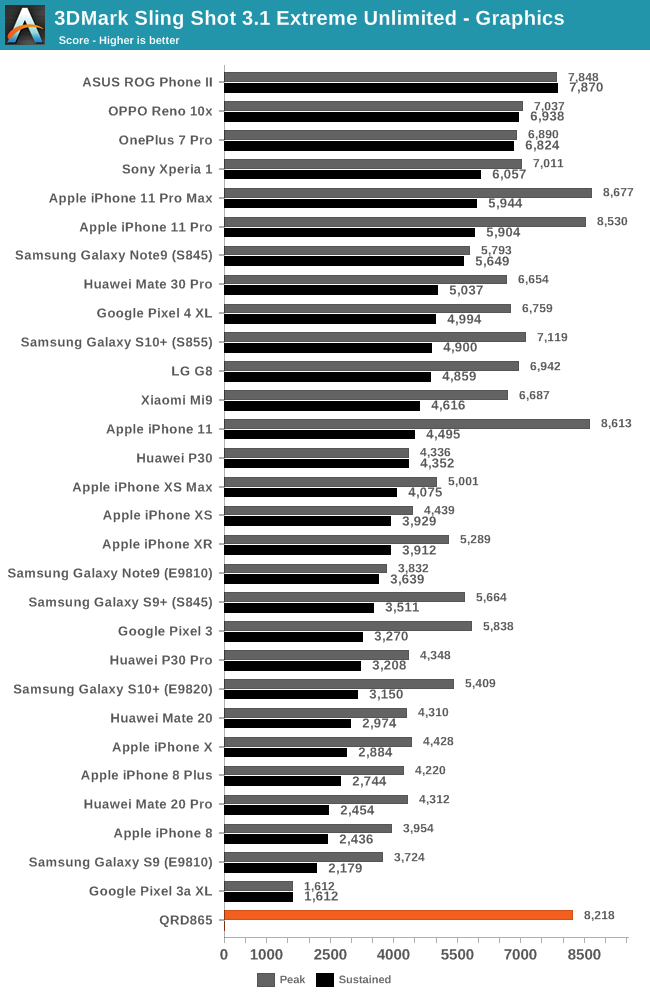
In the 3DMark Graphics test, the QRD865 results are more in line with what we expect of the GPU. Depending on which S855 you compare to, we’re seeing 15-22% improvements in the peak performance.
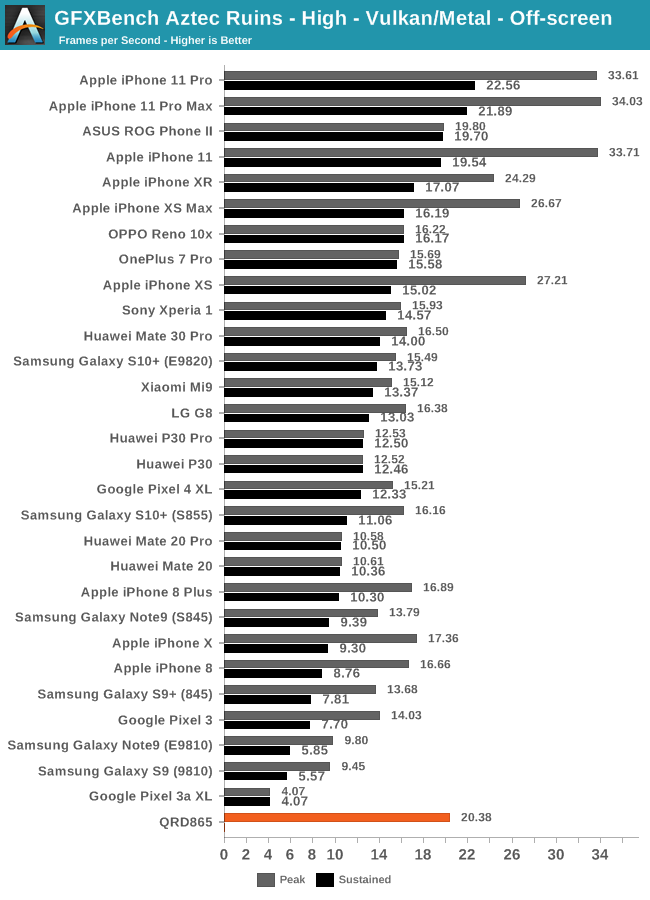
In the GFXBench Aztec High benchmark, the improvement over the Snapdragon 855 is roughly 26%. There’s one apparent issue here when looking at the chart rankings; although there’s an improvement in the peak performance, the end result is that the QRD865 still isn’t able to reach the sustained performance of Apple’s latest A13 phones.
| GFXBench Aztec High Offscreen Power Efficiency (System Active Power) |
||||
| Mfc. Process | FPS | Avg. Power (W) |
Perf/W Efficiency |
|
| iPhone 11 Pro (A13) Warm | N7P | 26.14 | 3.83 | 6.82 fps/W |
| iPhone 11 Pro (A13) Cold / Peak | N7P | 34.00 | 6.21 | 5.47 fps/W |
| iPhone XS (A12) Warm | N7 | 19.32 | 3.81 | 5.07 fps/W |
| iPhone XS (A12) Cold / Peak | N7 | 26.59 | 5.56 | 4.78 fps/W |
| QRD865 (Snapdragon 865) | N7P | 20.38 | 4.58 | 4.44 fps/W |
| Mate 30 Pro (Kirin 990 4G) | N7 | 16.50 | 3.96 | 4.16 fps/W |
| Galaxy 10+ (Snapdragon 855) | N7 | 16.17 | 4.69 | 3.44 fps/W |
| Galaxy 10+ (Exynos 9820) | 8LPP | 15.59 | 4.80 | 3.24 fps/W |
Looking at the estimated power draw of the phone, it indeed does look like Qualcomm has been able to sustain the same power levels as the S855, but the improvements in performance and efficiency here aren’t enough to catch up to either the A12 or A13, with Apple being both ahead in terms of performance, power and efficiency.
| GFXBench Aztec Normal Offscreen Power Efficiency (System Active Power) |
||||
| Mfc. Process | FPS | Avg. Power (W) |
Perf/W Efficiency |
|
| iPhone 11 Pro (A13) Warm | N7P | 73.27 | 4.07 | 18.00 fps/W |
| iPhone 11 Pro (A13) Cold / Peak | N7P | 91.62 | 6.08 | 15.06 fps/W |
| iPhone XS (A12) Warm | N7 | 55.70 | 3.88 | 14.35 fps/W |
| iPhone XS (A12) Cold / Peak | N7 | 76.00 | 5.59 | 13.59 fps/W |
| QRD865 (Snapdragon 865) | N7P | 53.65 | 4.65 | 11.53 fps/W |
| Mate 30 Pro (Kirin 990 4G) | N7 | 41.68 | 4.01 | 10.39 fps/W |
| Galaxy 10+ (Snapdragon 855) | N7 | 40.63 | 4.14 | 9.81 fps/W |
| Galaxy 10+ (Exynos 9820) | 8LPP | 40.18 | 4.62 | 8.69 fps/W |
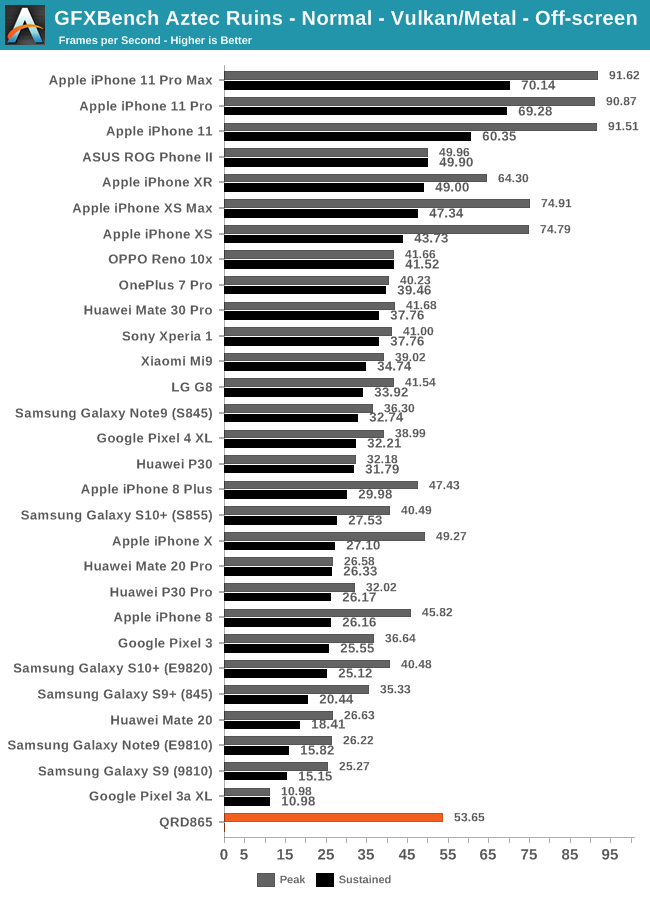
We’re seeing a similar scenario in the Normal variant of the Aztec test. Although the performance improvements here do match the promised figures, it’s not enough to catch up to Apple’s two latest SoC generations.
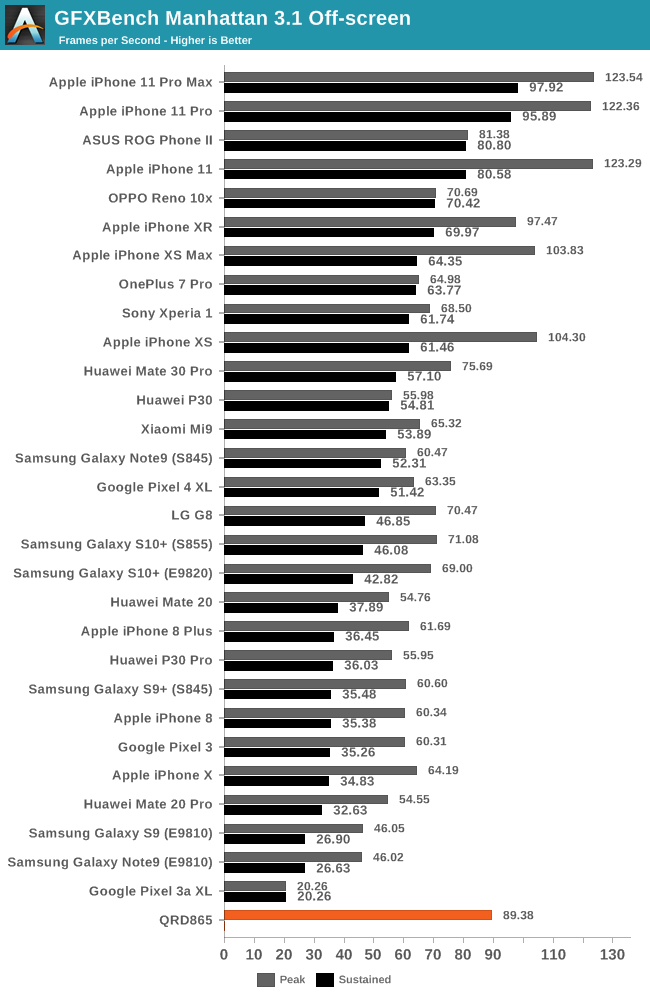
| GFXBench Manhattan 3.1 Offscreen Power Efficiency (System Active Power) |
||||
| Mfc. Process | FPS | Avg. Power (W) |
Perf/W Efficiency |
|
| iPhone 11 Pro (A13) Warm | N7P | 100.58 | 4.21 | 23.89 fps/W |
| iPhone 11 Pro (A13) Cold / Peak | N7P | 123.54 | 6.04 | 20.45 fps/W |
| iPhone XS (A12) Warm | N7 | 76.51 | 3.79 | 20.18 fps/W |
| iPhone XS (A12) Cold / Peak | N7 | 103.83 | 5.98 | 17.36 fps/W |
| QRD865 (Snapdragon 865) | N7P | 89.38 | 5.17 | 17.28 fps/W |
| Mate 30 Pro (Kirin 990 4G) | N7 | 75.69 | 5.04 | 15.01 fps/W |
| Galaxy 10+ (Snapdragon 855) | N7 | 70.67 | 4.88 | 14.46 fps/W |
| Galaxy 10+ (Exynos 9820) | 8LPP | 68.87 | 5.10 | 13.48 fps/W |
| Galaxy S9+ (Snapdragon 845) | 10LPP | 61.16 | 5.01 | 11.99 fps/W |
| Mate 20 Pro (Kirin 980) | N7 | 54.54 | 4.57 | 11.93 fps/W |
| Galaxy S9 (Exynos 9810) | 10LPP | 46.04 | 4.08 | 11.28 fps/W |
| Galaxy S8 (Snapdragon 835) | 10LPE | 38.90 | 3.79 | 10.26 fps/W |
| Galaxy S8 (Exynos 8895) | 10LPE | 42.49 | 7.35 | 5.78 fps/W |
Even on the more traditional tests such as Manhattan 3.1, although again the Adreno 650 is able to showcase good improvements this generation, it seems that Qualcomm didn’t aim quite high enough.
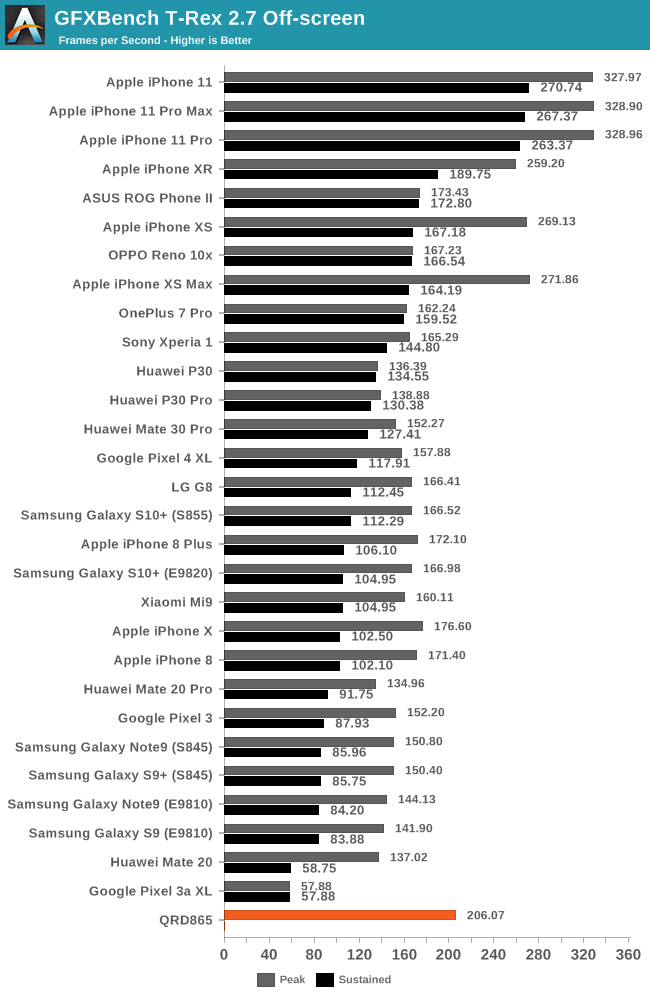
| GFXBench T-Rex Offscreen Power Efficiency (System Active Power) |
||||
| Mfc. Process | FPS | Avg. Power (W) |
Perf/W Efficiency |
|
| iPhone 11 Pro (A13) Warm | N7P | 289.03 | 4.78 | 60.46 fps/W |
| iPhone 11 Pro (A13) Cold / Peak | N7P | 328.90 | 5.93 | 55.46 fps/W |
| iPhone XS (A12) Warm | N7 | 197.80 | 3.95 | 50.07 fps/W |
| iPhone XS (A12) Cold / Peak | N7 | 271.86 | 6.10 | 44.56 fps/W |
| QRD865 (Snapdragon 865) | N7P | 206.07 | 4.70 | 43.84 fps/W |
| Galaxy 10+ (Snapdragon 855) | N7 | 167.16 | 4.10 | 40.70 fps/W |
| Mate 30 Pro (Kirin 990 4G) | N7 | 152.27 | 4.34 | 35.08 fps/W |
| Galaxy S9+ (Snapdragon 845) | 10LPP | 150.40 | 4.42 | 34.00 fps/W |
| Galaxy 10+ (Exynos 9820) | 8LPP | 166.00 | 4.96 | 33.40fps/W |
| Galaxy S9 (Exynos 9810) | 10LPP | 141.91 | 4.34 | 32.67 fps/W |
| Galaxy S8 (Snapdragon 835) | 10LPE | 108.20 | 3.45 | 31.31 fps/W |
| Mate 20 Pro (Kirin 980) | N7 | 135.75 | 4.64 | 29.25 fps/W |
| Galaxy S8 (Exynos 8895) | 10LPE | 121.00 | 5.86 | 20.65 fps/W |
Lastly, the T-Rex benchmark which is the least compute heavy workload tested here, and mostly is bottlenecked by texture and fillrate throughput, sees a 23% increase for the Snapdragon 865.
Overall GPU Conclusion – Good Improvements – Competitively Not Enough
Overall, we were able to verify the Snapdragon 865’s performance improvements and Qualcomm’s 25% claims seem to be largely accurate. The issue is that this doesn’t seem to be enough to keep up with the large improvements that Apple has been able to showcase over the last two generations.
During the chipset’s launch, Qualcomm was eager to mention that their product is able to showcase better long-term sustained performance than a competitor which “throttles within minutes”. While we don’t have confirmation as to whom exactly they were referring to, the data and narrative here only matches Apple’s device behaviour. Whilst we weren’t able to test the sustained performance of the QRD865 today, it unfortunately doesn’t really matter for Qualcomm as the Snapdragon 865 and Adreno 650’s peak performance falls in at a lower level than Apple’s A13 sustained performance.
Apple isn’t the only one Qualcomm has to worry about; the 25% performance increases this generation are within reach of Arm’s Mali-G77. In theory, Samsung’s Exynos 990 should be able to catch up with the Snapdragon 865. Qualcomm had been regarded as the mobile GPU leader over the last few years, but it’s clear that development has slowed down quite a lot recently, and the Adreno family has lost its crown.


178 Comments
View All Comments
gagegfg - Monday, December 16, 2019 - link
Qualcomm works for Android, so Apple's competition doesn't generate much trouble, just embarrassment. It seems that the second does not motivate them much haha.Drumsticks - Monday, December 16, 2019 - link
This comment might be too late to be seen, but is there any chance we can see the power use for the Zen 2/SKL (ICL?) based devices on the spec charts as well? It might be off by a lot, but I'm curious how they compare to the mobile SoCs. If they're too high because they're desktop chips intended for higher TDPs where maximum efficiency isn't needed, maybe it's worth it to throw in an Icelake-U number as well as a Zen 2 mobile chip when they come in.Andrei Frumusanu - Monday, December 16, 2019 - link
We never measured it accurately, the corresponding platform power for those desktop chips is generally going to be in the 30-40W range or even higher. The laptop platforms are also going to be in the 10-15W range.Drumsticks - Monday, December 16, 2019 - link
Fair enough; thanks for the reply! There is an awful lot more platform related stuff that isn't optimized on DT, I kind of derped on that.Thanks for your work on the article, too. I really enjoy your writeups and sympathize with the author who stays as engaged as you do with *every* commenter.
TEAMSWITCHER - Monday, December 16, 2019 - link
The ads on this site are obnoxious.TheinsanegamerN - Tuesday, December 17, 2019 - link
-Not using an adblocker in 2019....GH-CC - Monday, December 16, 2019 - link
I'm not engineer, not much knowlege but one part in this article really concerns me:"Generally, we’ve noted that there’s a discrepancy factor of roughly 3x. We’ve reached out to Qualcomm and they confirmed in a very quick testing that there’s a discrepancy of >2.5x. Furthermore, the QRD865 phones this year again suffered from excessive idle power figures of >1.3W."
Does this mean compared to SD855, SD865 consume more power when idling?
Also, was this test conducted with internet connection or not?
Andrei Frumusanu - Monday, December 16, 2019 - link
The above quote is only valid for the QRD865; similar thing happened to the QRD855 test devices. It's not a concern for final commercial devices, so nothing to worry about.assyn - Monday, December 16, 2019 - link
Seems like Apple is basically untouchable.Evben an old A11 humiliating the top Android soc..:D
joms_us - Monday, December 16, 2019 - link
Humiliating by what? Some imaginary worthless bloated benchmark scores from a primitive tool that doesn't translate to real-world? For the last 2 years Apple is the one catching up in any side-by-side comparisons out there.