The AMD Ryzen 9 3950X Review: 16 Cores on 7nm with PCIe 4.0
by Dr. Ian Cutress on November 14, 2019 9:00 AM ESTCPU Performance: Web and Legacy Tests
While more the focus of low-end and small form factor systems, web-based benchmarks are notoriously difficult to standardize. Modern web browsers are frequently updated, with no recourse to disable those updates, and as such there is difficulty in keeping a common platform. The fast paced nature of browser development means that version numbers (and performance) can change from week to week. Despite this, web tests are often a good measure of user experience: a lot of what most office work is today revolves around web applications, particularly email and office apps, but also interfaces and development environments. Our web tests include some of the industry standard tests, as well as a few popular but older tests.
We have also included our legacy benchmarks in this section, representing a stack of older code for popular benchmarks.
All of our benchmark results can also be found in our benchmark engine, Bench.
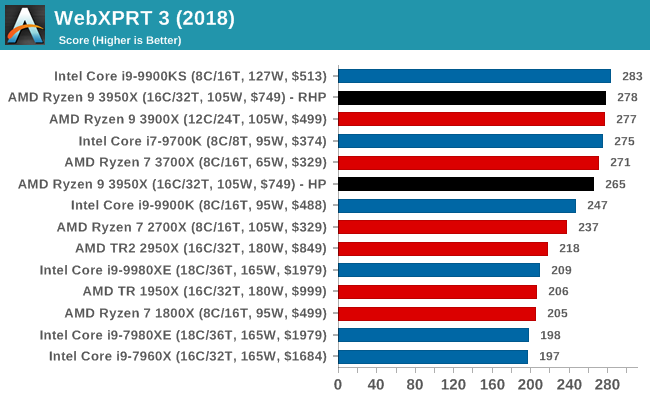
WebXPRT 3: Modern Real-World Web Tasks, including AI
The company behind the XPRT test suites, Principled Technologies, has recently released the latest web-test, and rather than attach a year to the name have just called it ‘3’. This latest test (as we started the suite) has built upon and developed the ethos of previous tests: user interaction, office compute, graph generation, list sorting, HTML5, image manipulation, and even goes as far as some AI testing.
For our benchmark, we run the standard test which goes through the benchmark list seven times and provides a final result. We run this standard test four times, and take an average.
Users can access the WebXPRT test at http://principledtechnologies.com/benchmarkxprt/webxprt/
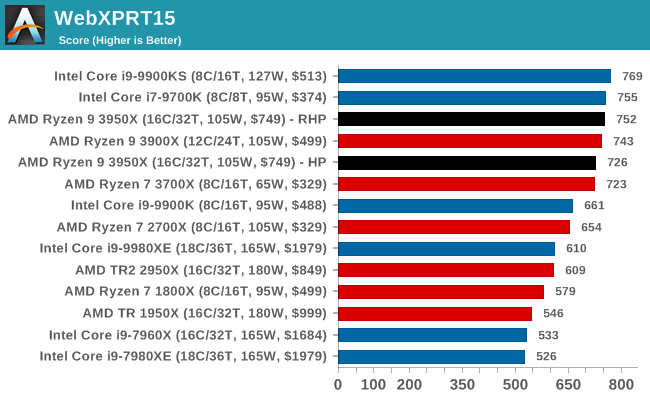
WebXPRT 2015: HTML5 and Javascript Web UX Testing
The older version of WebXPRT is the 2015 edition, which focuses on a slightly different set of web technologies and frameworks that are in use today. This is still a relevant test, especially for users interacting with not-the-latest web applications in the market, of which there are a lot. Web framework development is often very quick but with high turnover, meaning that frameworks are quickly developed, built-upon, used, and then developers move on to the next, and adjusting an application to a new framework is a difficult arduous task, especially with rapid development cycles. This leaves a lot of applications as ‘fixed-in-time’, and relevant to user experience for many years.
Similar to WebXPRT3, the main benchmark is a sectional run repeated seven times, with a final score. We repeat the whole thing four times, and average those final scores.
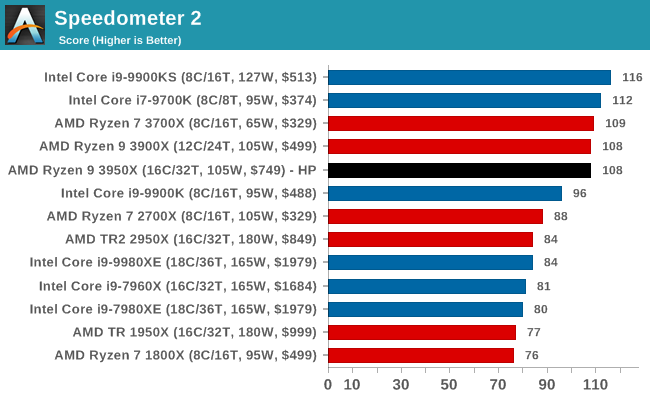
Speedometer 2: JavaScript Frameworks
Our newest web test is Speedometer 2, which is a accrued test over a series of javascript frameworks to do three simple things: built a list, enable each item in the list, and remove the list. All the frameworks implement the same visual cues, but obviously apply them from different coding angles.
Our test goes through the list of frameworks, and produces a final score indicative of ‘rpm’, one of the benchmarks internal metrics. We report this final score.
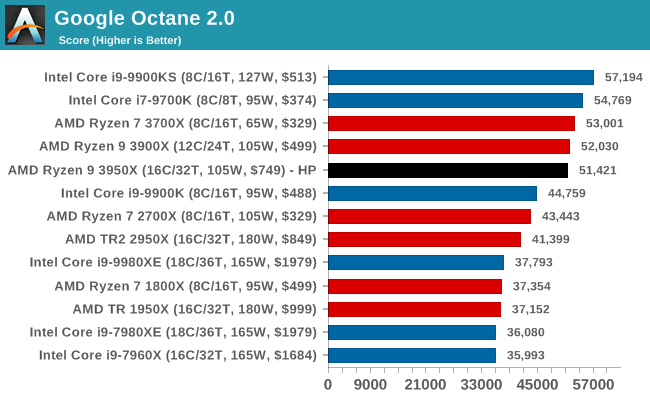
Google Octane 2.0: Core Web Compute
A popular web test for several years, but now no longer being updated, is Octane, developed by Google. Version 2.0 of the test performs the best part of two-dozen compute related tasks, such as regular expressions, cryptography, ray tracing, emulation, and Navier-Stokes physics calculations.
The test gives each sub-test a score and produces a geometric mean of the set as a final result. We run the full benchmark four times, and average the final results.
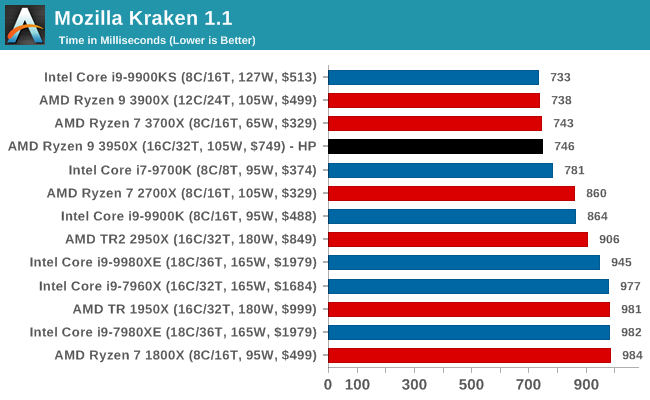
Mozilla Kraken 1.1: Core Web Compute
Even older than Octane is Kraken, this time developed by Mozilla. This is an older test that does similar computational mechanics, such as audio processing or image filtering. Kraken seems to produce a highly variable result depending on the browser version, as it is a test that is keenly optimized for.
The main benchmark runs through each of the sub-tests ten times and produces an average time to completion for each loop, given in milliseconds. We run the full benchmark four times and take an average of the time taken.
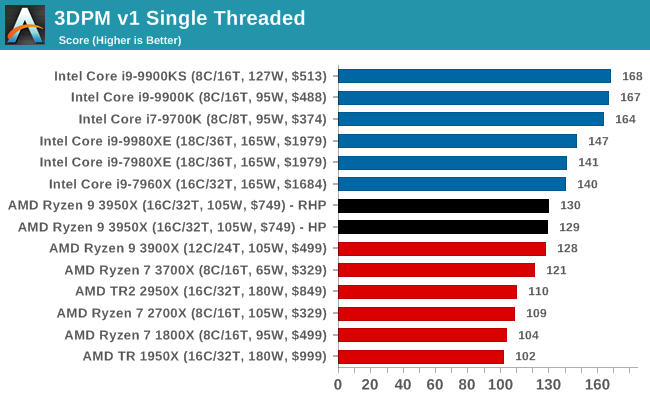
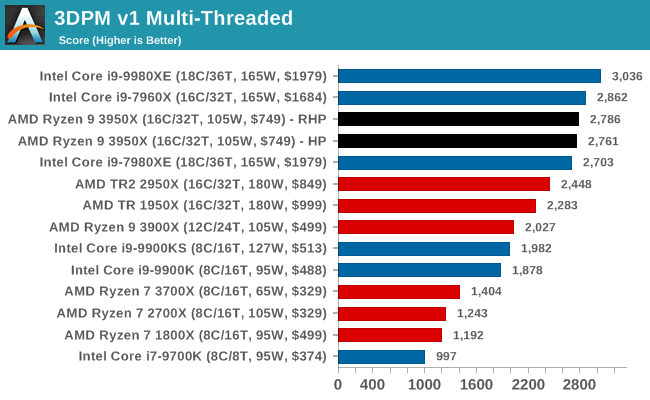
3DPM v1: Naïve Code Variant of 3DPM v2.1
The first legacy test in the suite is the first version of our 3DPM benchmark. This is the ultimate naïve version of the code, as if it was written by scientist with no knowledge of how computer hardware, compilers, or optimization works (which in fact, it was at the start). This represents a large body of scientific simulation out in the wild, where getting the answer is more important than it being fast (getting a result in 4 days is acceptable if it’s correct, rather than sending someone away for a year to learn to code and getting the result in 5 minutes).
In this version, the only real optimization was in the compiler flags (-O2, -fp:fast), compiling it in release mode, and enabling OpenMP in the main compute loops. The loops were not configured for function size, and one of the key slowdowns is false sharing in the cache. It also has long dependency chains based on the random number generation, which leads to relatively poor performance on specific compute microarchitectures.
3DPM v1 can be downloaded with our 3DPM v2 code here: 3DPMv2.1.rar (13.0 MB)
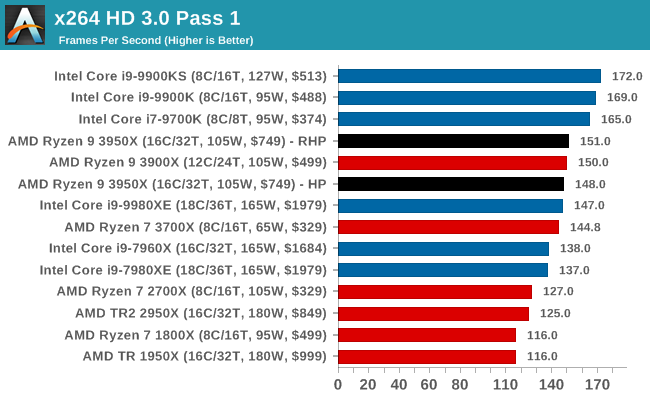
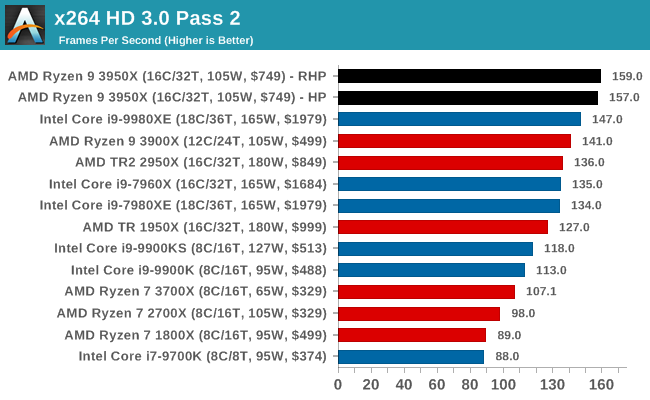
x264 HD 3.0: Older Transcode Test
This transcoding test is super old, and was used by Anand back in the day of Pentium 4 and Athlon II processors. Here a standardized 720p video is transcoded with a two-pass conversion, with the benchmark showing the frames-per-second of each pass. This benchmark is single-threaded, and between some micro-architectures we seem to actually hit an instructions-per-clock wall.
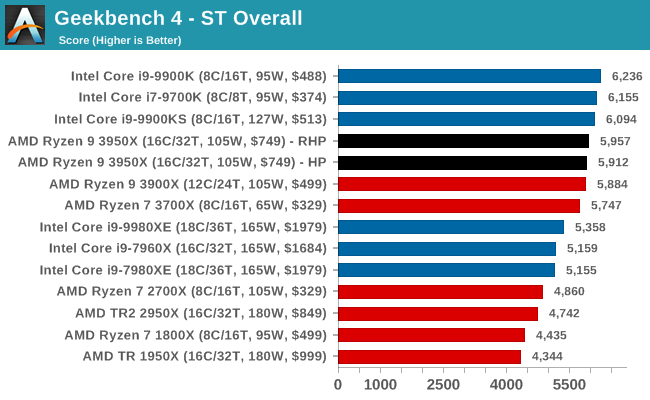
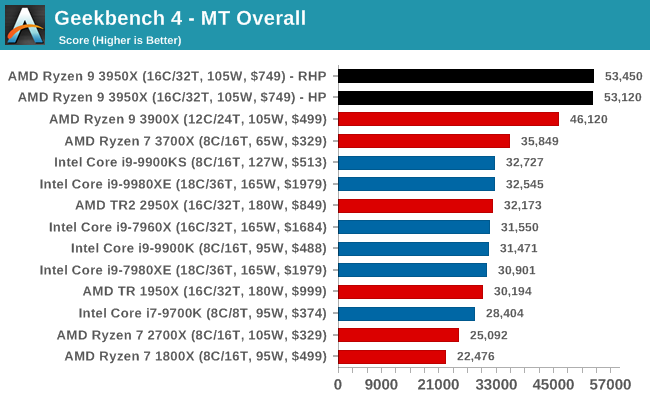
GeekBench4: Synthetics
A common tool for cross-platform testing between mobile, PC, and Mac, GeekBench 4 is an ultimate exercise in synthetic testing across a range of algorithms looking for peak throughput. Tests include encryption, compression, fast Fourier transform, memory operations, n-body physics, matrix operations, histogram manipulation, and HTML parsing.
I’m including this test due to popular demand, although the results do come across as overly synthetic, and a lot of users often put a lot of weight behind the test due to the fact that it is compiled across different platforms (although with different compilers).
We record the main subtest scores (Crypto, Integer, Floating Point, Memory) in our benchmark database, but for the review we post the overall single and multi-threaded results.


206 Comments
View All Comments
Netmsm - Saturday, November 16, 2019 - link
Also, in section "x264 HD 3.0: Older Transcode Test" the result of "3DPM v1 Multi-Threaded" is mistakenly placed instead of "x264 HD 3.0 Pass 2".The_Assimilator - Thursday, November 14, 2019 - link
"I’m sure some people will disagree about those 50 MHz"We call those people "whiny bitches who should STFU".
nathanddrews - Thursday, November 14, 2019 - link
In a world of such precision and technical pedants, you have to admit that it is false advertising to say 4.7GHz, when it is 50MHz shy. Rounded up, it's OK, but it's only 1% shady.For my use case, this sentence nails it perfectly: "the Core i9-9900KS is still running at 5.0 GHz for sustained single threaded work, which is still 7-15% higher than the Ryzen 3950X, and as a result it does pull out ahead in a number of ST tests as well as in low resolution (CPU-bound) gaming". Most of the games I play are not current-gen visual spectacles, but rather twitch and competitive games that are a few years old. My priority is the highest possible frame rates for high refresh gaming. I'm not sure that I do enough video editing to justify Ryzen, as tempting as the rest of the package is.
Cooe - Thursday, November 14, 2019 - link
Most every other review I've seen has it hitting the full 4.7GHz, with many even going beyond into the 4.75GHz range when adequate cooling is used. The silicon binning quality of the 3950X seems to be absolutely freaking insane. Meethinks this -50MHz deficit is unique to something specific to Ian's setup here.RSAUser - Thursday, November 14, 2019 - link
Gamersnexus also seems to have gotten a bit of a dud. LTT seems to have gotten a good one.Cooe - Thursday, November 14, 2019 - link
Not just Linus, most people have gotten "good ones". I can count the number reviews with chips that didn't reach the advertised 4.7GHz on one hand & have fingers left over to spare (and if I include all those within 50ishMHz or so, like Ian's here, it drops to just one).zmatt - Thursday, November 14, 2019 - link
Every cpu I have ever owned has always been a percent or so off the advertised frequency either above or below. The number on the box is really just an average and always has been.uefi - Thursday, November 14, 2019 - link
Don't forget, Intel has their share of the occasional performance shaving microcode patches every year or so.eek2121 - Thursday, November 14, 2019 - link
I walked away with a very different picture. Right now Anandtech is clearly GPU bound in the benchmarks. They are benchmarking on a GTX 1080, and the results clearly reflect that. Having run some of these games on a 1080ti on my stock 1950X, I get a better result. They really need a 2080ti or 2080 super at this point.plonk420 - Thursday, November 14, 2019 - link
they can't really use a 1080Ti or better with GTA5... check out GN's coverage: if you hit over ~180fps, you hit a cap that results in insane stuttering (same with RDR2 and 144hz or so)